Page 26
© Copyright 2008-2012 Energy, Inc. All rights reserved
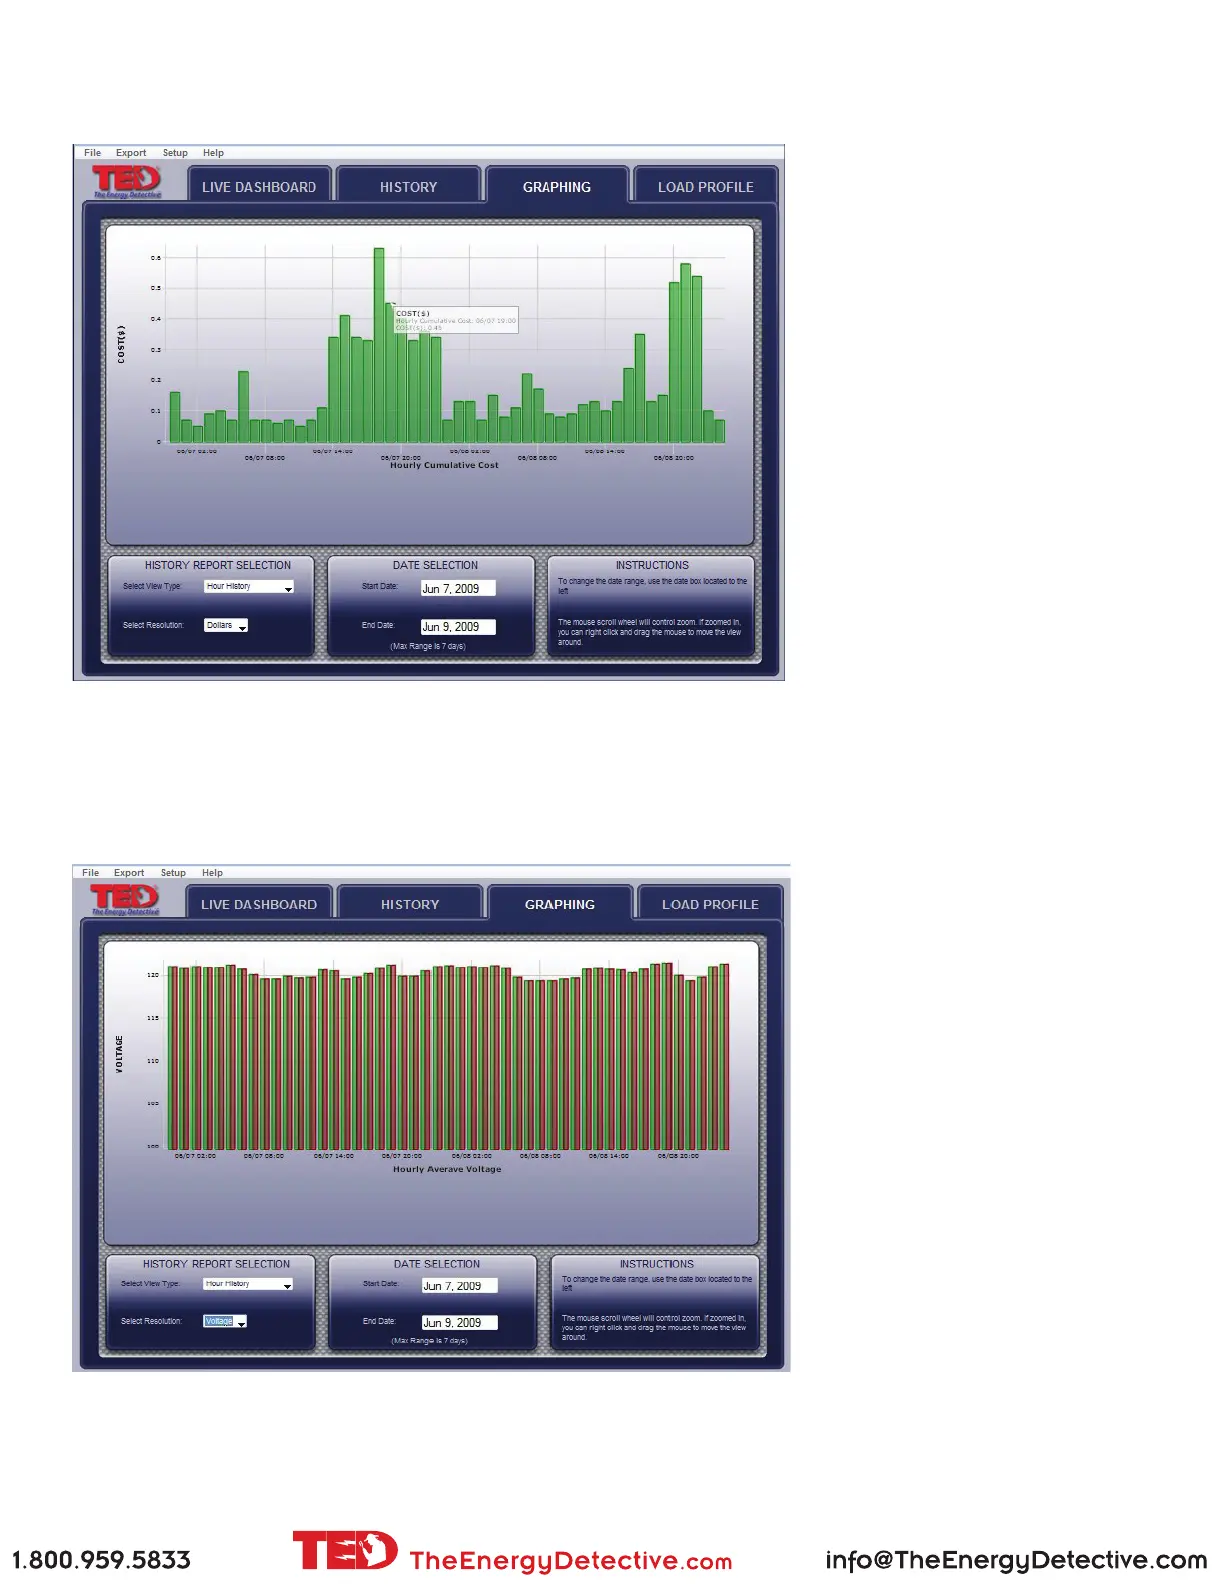
Sample - HOUR graph of Dollars spent - range selected is 2 Days
This is a 2-day view showing the
Dollars spent each hour of the
day.
Hover over any point to see the
specic usage detail.
Sample - HOUR graph of Minimum and Maximum Voltage - range selected is 2 Days
This is a 2-day view showing the
mimimum and maximum voltage
delivered to your home over a 2-
day period.
As with all graphs, hover over
any point on the graph to see the
specic detail.