Page 27
www.theenergydetective.com
Page 27
v.3.3.1
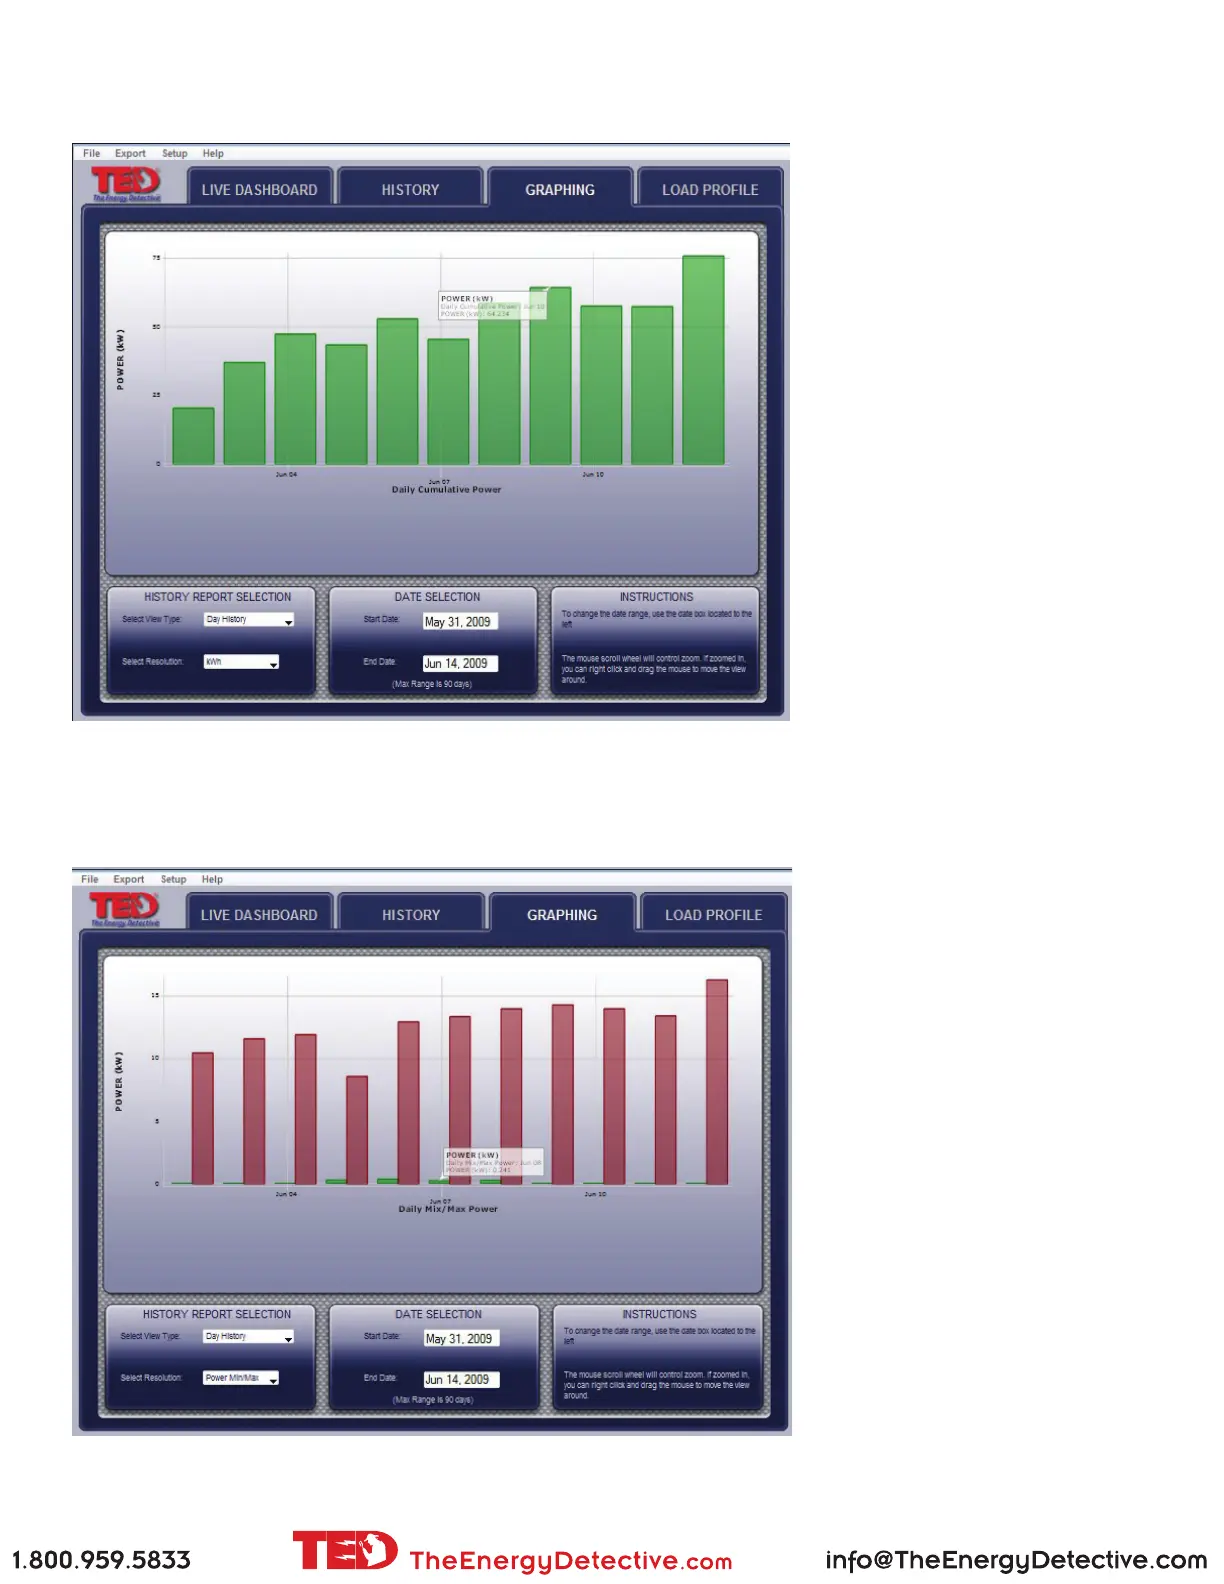
Sample - DAY graph of kWh usage - range selected is 7 Days
This is a 7-day view showing the
kWh used each day.
See what days most electricity
is used. What took place those
days?
Sample - DAY graph of Minimum and Maximum kW usage - range selected is 7 Days
This is a 7-day view showing the
minimum and maximum kW used
each day.
Why so high?!
Why so low?!
How low can you go?