Page 28
© Copyright 2008-2012 Energy, Inc. All rights reserved
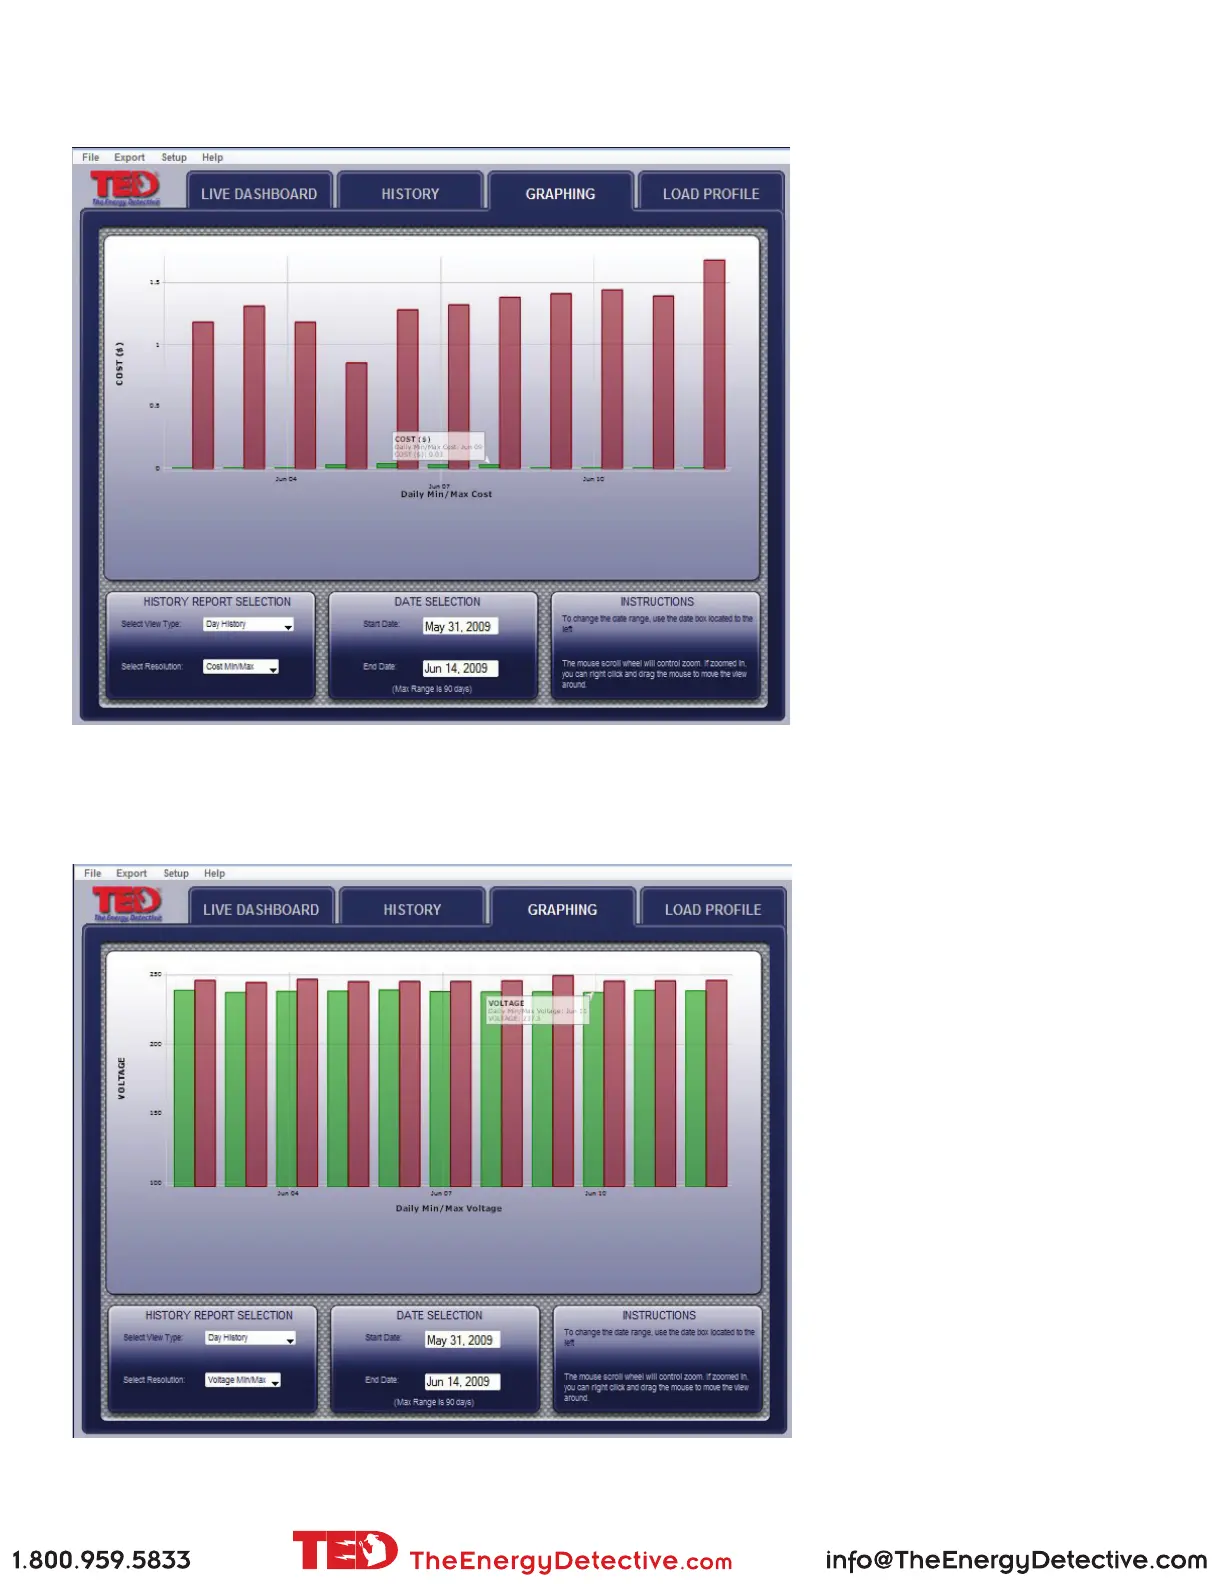
This is a 7-day view showing the
most and least amount of money
spent each day.
Now it’s meaningful! The money
counts.
Sample - DAY graph of Minimum and Maximum of Money Spent - range 7 days
Sample - DAY graph of Minimum and Maximum of Voltage - range 11 days
This is a 11-day view showing the
most and least amount of voltage
each day coming from the utility.
The Solar/Wind package will
show the generation, grid-supplied
power, and the net.