plays on the CRT that are not tunable with the RF center fre-
quency controls.
2. Image response-The superheterodyne process results
in two major IF responses, separated from each other by
twice the IF. The spectrum analyzer is usually calibrated to
only one of these two responses. The other is called the
image.
3. Harmonic conversion-The spectrum analyzer will re-
spond to signals that mix with harmonics of the local oscil-
lator and produce the intermediate frequency. Most spect-
rum analyzers have dials calibrated for some of these higher
order conversions. The uncalibrated conversions are spurious
responses.
4. Intermodulation-in the case of more than one input
signal, the myriad of combinations of the sums and differ-
ences of these signals between themselves and their multiples
creates extraneous response known as intermodulation. The
most harmful intermodulation is third order, caused by the
second harmonic of one signal combining with the funda-
mental of another.
5. Video detection-The first mixer will act as a video de-
tector if sufficient input signal is applied, A narrow pulse
may have sufficient energy at the intermediate frequency
to show up as an intermediate frequency feedthrough.
6. Internal-A spurious response on the display caused
by a signal generated within the spectrum analyzer that is
in no way connected with an external signal.
7. Anomalous IF responses-The filter characteristic of the
resolutian-dete rmining amplifier may exhibit extraneous pass-
bands. This results in extraneous spectrum analyzer responses
when a signal is being analyzed.
8. Zero frequency feedthrough-(zero pip)-The response
produced when the first local oscillator frequency is within
the IF passband. This corresponds to zero input frequency
and is sometimes not suppressed so as to act as a zero fre-
quency marker.
Sweep repetition rate-The number of sweep excursions
per unit of time. Approximately the inverse of sweep time
for a free-running sweep.
Sweep time-The time required for the spot on the refer-
ence coordinate (frequency in spectrum analyzer) to move
across the graticule, (In a linear spectrum system, sweep
time is Time/Division multiplied by total divisions.)
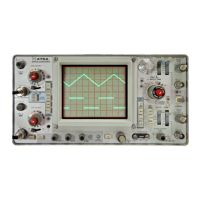
CONTROLS AND CONNECTORS
The following is a brief description of the operation or
function of the controls and connectors on the front (see Fig.
2-4) and rear panel, A more detailed description is given
later in this section under operating information.
CRT Controls
lNTENSITY-Controls brightness of the CRT trace
SCALE ILLUM-Controls graticule light level.
FOCUS-Adjusts spot size for optimum display definition.
ASTIGMATISM-Used in conjunction with the FOCUS con-
trol to adjust spot shape and obtain optimum display de-
finition.
INTENSIFIER-Controls the relative brightness between the
displayed signal and the trace baseline.
POSITION-TWO (2) controls that position the CRT beam
in the vertical and horizontal plane.
Time Base Controls
TIME/DIV-Selects calibrated sweep rates from 0.5 s/div to
10 µs/div in a 1-2-5 sequence.
VARIABLE-Permits an uncalibrated overlapping adjust-
ment of the sweep rate so the sweep rate may be varied
continuously from 10 µs/div to approximately 1.25 s/div.
Trigger Controls
SLOPE-Selects the positive or negative portion of
input signal to trigger the time base,
LEVEL-Selects the amplitude point on the triggering
the
sig-
nal where sweep triggering occurs. In the fully clockwise
position, the sweep circuit free runs.
SOURCE-Selects signal source for triggering the time
base. Selections are: INT (from vertical amplifier); LINE
(line voltage frequency); EXT (external signal applied to the
rear panel BNC connector labeled TRIG IN).
Spectrum Analyzer Section (IF)
DISPERSION RANGE-Selects the range of the DISPER
SION selector.
DISPERSION—Selects the dispersion (frequency width) of
the display in conjunction with the DISPERSION RANGE
switch. Dispersion selections are 10 MHz/div to 1 kHz/div
in a 1-2-5 sequence plus 0 dispersion position.
When the DISPERSION selector is in the 0 position, the
analyzer functions as a fixed tuned receiver, permitting
displays of the time domain characteristics of modulation
within the resolution bandwidth capabilities of the analy-
zer.
COUPLED RESOLUTION-Selects the analyzer resolution
bandwidth. Eleven selectable ranges from approximately
100 kHz to less than 1 kHz are provided. Optimum resolu-
tion for a given dispersion is generally obtained with the
RESOLUTION control coupled to the DISPERSION selector.
DISPERSION CAL—A screwdriver adjustment to calibrate
the MHz/div dispersion.
DISPERSION BAL-Adjusted to balance the dispersion cen-
ter (center freqeuncy point) of the MHz/DIV and kHz/
DIV positions of the DISPERSION RANGE switch.
IF ATTENUATOR dB-Series of six toggle switches to pro
vide a range of IF attenuation from 1 dB to 51 dB.
GAIN-A variable control of the analyzer IF gain.
IF CENTER FREQ-A 10 turn control that adjusts the IF
center frequency of the display. Provides a + and - 10
MHz adjustment in 10 MHz/DIV dispersion position, a +
and - 25 MHz adjustment of the center frequency through
the 5 MHz/div to 0.2 MHz/div positions and a + and -
2.5 MHz adjustments through the 500 kHz/div to 1 kHz/div
DISPERSION positions.
2-4
 Loading...