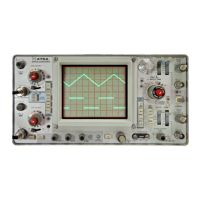
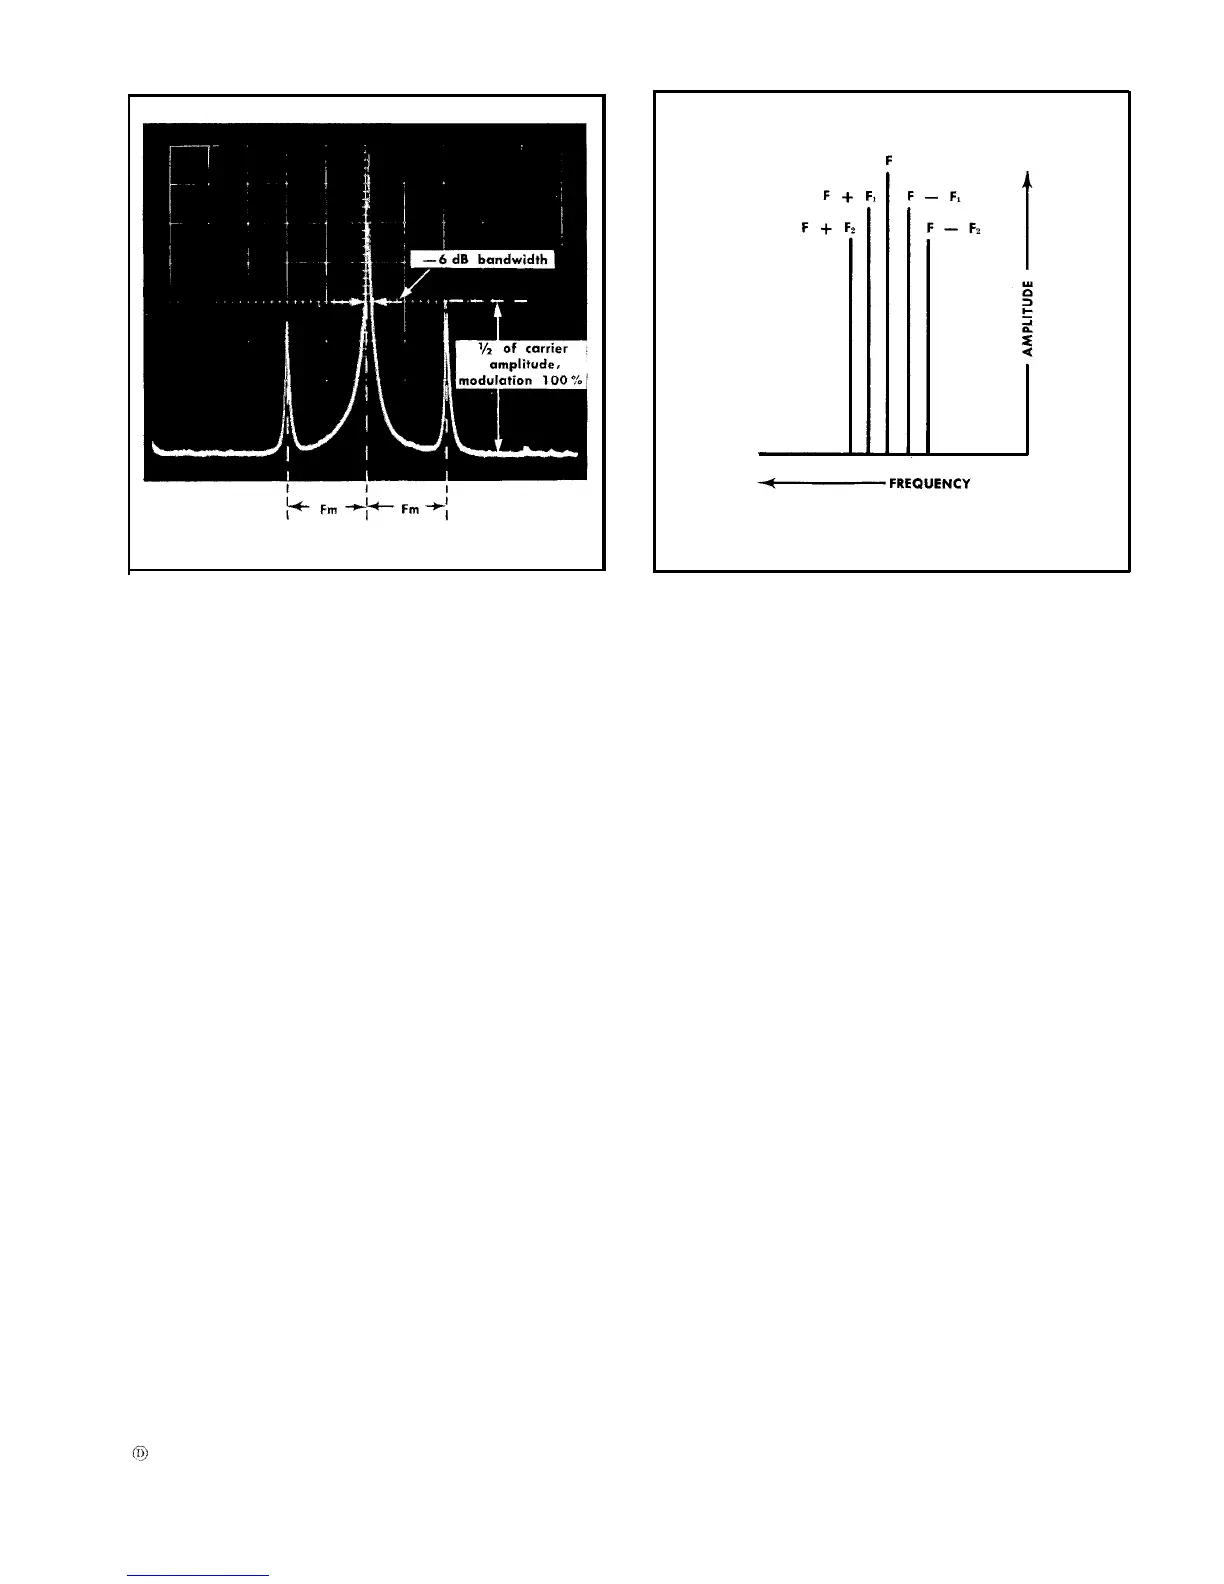
Fig. 2-18. Spectrum of an amplitude modulated signal. Sideband
amplitude is ½ the percentage of modulation. This spectrum shows
100% modulation.
3. Decrease the dispersion to open the screen. Keep the
signal centered on screen with the IF CENTER FREQ controls.
If the local oscillator should lose its lock condition when the
dispersion settings are 100 kHz or less, the signal will dis-
appear from the screen. A slight adjustment of the FINE RF
CENTER FREQ control will usually return the signal to the
display.
4. If two or more high frequency (upper scale) signals are
to be resolved, they can be moved on the display without
losing phase lock by adjusting the INT REF FREQ control.
Recorder Out Connector
Signals on the display may be recorded by connecting to
the RECORDER output connector on the rear panel. A linear
output is provided when the VERTICAL DISPLAY switch is in
the LOG and LIN positions. With the DISPLAY switch in
the SQ LAW position, the output to the RECORDER con-
nector is square law.
Control Setup Chart
Fig. 2-17 is a control setup chart for the front panel of the
Type 491. This figure may be reproduced and used as a test
setup record for special applications or procedures. It may
also serve as a training aid to facilitate control operation.
SPECTRUM ANALYZER DISPLAYS
The Spectrum Analyzer displays a plot of signal amplitude
as a function of frequency. With this type of display, in
the frequency domain, individual frequency. components in
the signal can be displayed and readily analyzed. This
section describes some basic spectrum analyzer displays.
Fig. 2-19. Formation of a spectrum.
F is the fundamental or carrier
frequency, F
1
and F
2
are the modulating frequencies.
Spectrum of Amplitude Modulation
When a single frequency (CW) signal is amplitude-modu-
lated by a single frequency, two additional frequencies will
be generated; the carrier plus the two side bands. See Fig.
2-18. The amplitude of either sideband with respect to the
carrier voltage is ½ the percentage of modulation. The
frequency difference between the carrier and either sideband
equals the modulating frequency.
Figure 2-19 illustrates how a spectrum is generated when
a fundamental carrier frequency F is modulated by two
frequencies F
1
and F
2
.
The sideband spectrum af multiple frequency amplitude-
modulated signal spectrum is determined by the modulating
frequencies. To resolve this complex spectrum, the analyzer
resolution bandwidth must be less than the lowest modulating
frequency, or the bandwidth must be less than the difference
between any two modulating frequencies, whichever is the
smaller.
In wideband amplitude-modulation such as television pic-
ture information, the spectrum analyzer may be used to
measure the sideband energy distribution and modulation
bandwidth.
The amplitude modulated signal spectrum will therefore
furnish the following information: 1) Fundamental or carrier
frequency, 2) modulation frequency or frequencies, 3) modu-
lation percentage, 4) sideband energy distribution and 5)
modulation bandwidth. Other characteristics which may
be evaluated are; degree of incidental FM (evidenced by
signal jitter), nonlinear modulation, and over-modulation.
These characteristics will be described in more detail with
other types of spectrum display patterns.
2-17
 Loading...