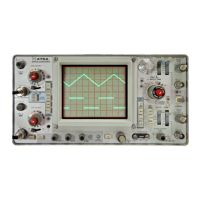
Fig. 2-20. Formation of a pulse modulated signal spectrum.
Frequency Modulated Signal Spectrum
When a CW signal F
C
is frequency modulated at a rate
(F
m
), it will theoretically produce an infinite number of side-
band frequencies. These frequencies are equal to (F
C
±
nF
m
where n = 1, 2, 3, etc.
Frequency modulated signal bandwidth is usually deter-
mined by the width of the sidebands containing sufficient
energy to dominate the display. Signal bandwidth is approx-
imately equal to
+ F
m
) where is the frequency
deviation of the carrier and F
m
is the frequency of the mod-
ulating signal. Frequency deviation of the carrier is pri-
marily dependent on the modulating signal amplitude.
This ratio of frequency deviation to modulating frequency
is known as modulation index. Bessel function and frequency
spectrum for different modulation indices may be found in
the 4th edition of Reference Data for Radio Engineers, Chap-
ter 19.
To resolve adjacent sideband components in a frequency
modulated display, the spectrum analyzer resolution band-
width should be less than the lowest modulating frequency
in the spectrum which is the same as the requirements for an
amplitude modulated spectrum.
Pulse Modulated Signal Spectrum
When a CW signal is pulse modulated, the carrier is per-
iodically turned on and off. The on period is determined by
the modulating pulse width, the off periods is related to the
pulse repetition rate or frequency. The carrier is usually
modulated with rectangular shaped pulses.
A square wave is composed of its fundamental frequency
plus the odd harmonics. If the relative amplitudes and phase
of the harmonics are changed, a number of waves hapes are
produced; rectangular, trapezoidal, sawtooth, etc. The spec-
trum of the square wave or any pulse shape is displayed
according to its frequency components and their amplitudes.
Common pulse forms and their spectrum are described in
Reference Data for Radio Engineers, 4th edition, Chapter 35,
ITT 1956.
Fig. 2-20A illustrates a theoretical voltage spectrum of a
square-pulse, pulse-modulated oscillator. The main lobe and
the side lobes are shown as groups of spectral lines extend-
ing above and below the baseline, The number of these side
lobes for a truly rectangular pulse, approaches infinity, since
the number of harmonics in a square pulse approaches an
infinite quantity. Any two adjacent side lobes are separated
an the frequency scale by a distance equal to the inverse of
the modulating pulse width. See Fig. 2-20A.
Fourier theory shows that adjacent lobes are “180° out of
phase; however, since the spectrum analyzer is insensitive
to phase, only the absolute value of the spectrum is displayed
and appears as illustrated in Fig. 2-20B.
Fig. 2-21 illustrates the relative effects the pulse width
and pulse repetition frequency have on a pulsed RF spectrum.
Since the spacing between the spectral lines of the pulsed
RF spectrum is a function of the PRF, the spectrum analyzer
resolution bandwidth should be less than the PRF to respond
to one frequency component at a time. In mast instances this
is impractical; for example, a short pulse at a PRF of 100 hertz,
would require an effective
resolution of 100 hertz. This
would produce an extremely fine grain display, and would
be impractical for analysis.
The spectrum envelope, however, is plotted with pulses
instead of lines. If the analyzer is swept slowly, it will plot
a series of pips or lines, the focus of which repre-
sents the relative energy distribution of the swept spec-
trum. The number or density of these pips for a given PRF
will depend on the sweep speed, or TIME/DIV selection, on
the analyzer. It is possible, by sweeping very slowly, to obtain
the spectrum of a very low PRF signal. This display closely
simulates a pulsed spectrum and contains the same informa-
tion for analysis. This spectrum may now be resolved, since
the resolution bandwidth of the analyzer need only be less
than the side lobe frequency width, or the reciprocal of the
modulating pulse width. Fig. 2-22 illustrates the effects the
pulse shape will have an the RF spectrum. Notice the reduc-
tion of side lobes when the pulse is no longer rectangular;
Fig. 2-22C.
2-18
 Loading...