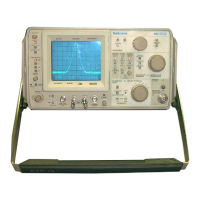
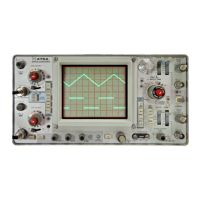
Fig. 2-21. Pulse width and PRF effects on pulse modulated spectrum.
Identification and Frequency Measurement of
Displayed Signals
Bandpass and dispersion characteristics of spectrum an-
alyzers require very limited preelection ahead of the first
mixer. Signals with frequencies different than that indicated
by the dial will therefore appear on the display. These
signals are called spurious responses. See spurious responses
under Spectrum Analyzer Terms at the beginning of this sec-
tion.
The dial scales for the Type 491 indicate frequencies that
are below the local oscillator frequency by the IF (200 MHz).
For example: a dial reading of 700 MHz means the local
oscillator frequency of 900 MHz (700 MHz + 200 MHz). This
local oscillator frequency will mix with 700 MHz and 1100
MHz to produce the IF of 200 MHz. The 1100 MHz response
is called the image. Note that the image response is twice
the IF away from the true, or dial calibrated response. Har-
monics of the local oscillator fundamental frequency also
convert incoming signals to the IF response. For example,
the second harmonic of 900 MHz (1800 MHz] will mix with
1600 MHz and 2000 MHz.
These response are identified and read as follows:
1. Tune the RF Center Frequency across a dispersion win-
dow and observe the signal movement.
2. True responses move across the dispersion window from
left to right, on the Type 491, as the RF CENTER FREQUENCY
is increased, or in the same direction as the tuning knob
is turned.
3. Images move across the dispersion window opposite to
the direction of the true response.
4. IF feedthrough signals are not tunable and remain fixed
in position as the RF CENTER FREQUENCY is tuned.
5. Signal frequency shifts across the dispersion window that
are not coincident with the RF CENTER FREQUENCY change
are spurious.
Some of these spurii are mixing with higher
harmonics of the local oscillator. The upper dial scales of
the Type 491 are calibrated to harmonics of the local os-
2-19

 Loading...
