Calibration—492/492P Service Vol. 1 (SN B030000 & up)
Performance Check
16. Check Residual FM (within 1 kHz for 20 ms
without phaselock, and within 50 Hz for 20 ms with
Option 03 phaselock)
a. Set the FREQUENCY RANGE to band 1 (0—4.2 GHz
or 0—1.8 GHz Option 01). If the 492/492P has phaselock,
cancel PHASE LOCK and center the calibrator signal with
the FREQUENCY control. (Increase FREQ SPAN/DIV to lo
cate signal if off screen, then return to 10 kHz/div.)
b. Set RESOLUTION BANDWIDTH to 10 kHz and the
Vertical Display to LIN. Activate FINE and adjust REF LEV
EL for a full screen display.
e. If the instrument has phaselock, proceed as follows:
1) switch TIME/DIV to AUTO and activate PHASE
LOCK. Increase FREQ SPAN/DIV to bring the signal on
screen, then reduce the span to 500 Hz/div and the RES
OLUTION BANDWIDTH to 1 kHz. Keep the signal cen
tered with the FREQUENCY control;
2 ) calculate the slope as described in part c;
3) switch to zero span and TIME/DIV to 10 ms/div; then
measure residual FM using the same technique de
scribed above. Residual FM, for Option 03 instruments,
must not exceed 50 Hz for a 20 ms period or two
divisions.
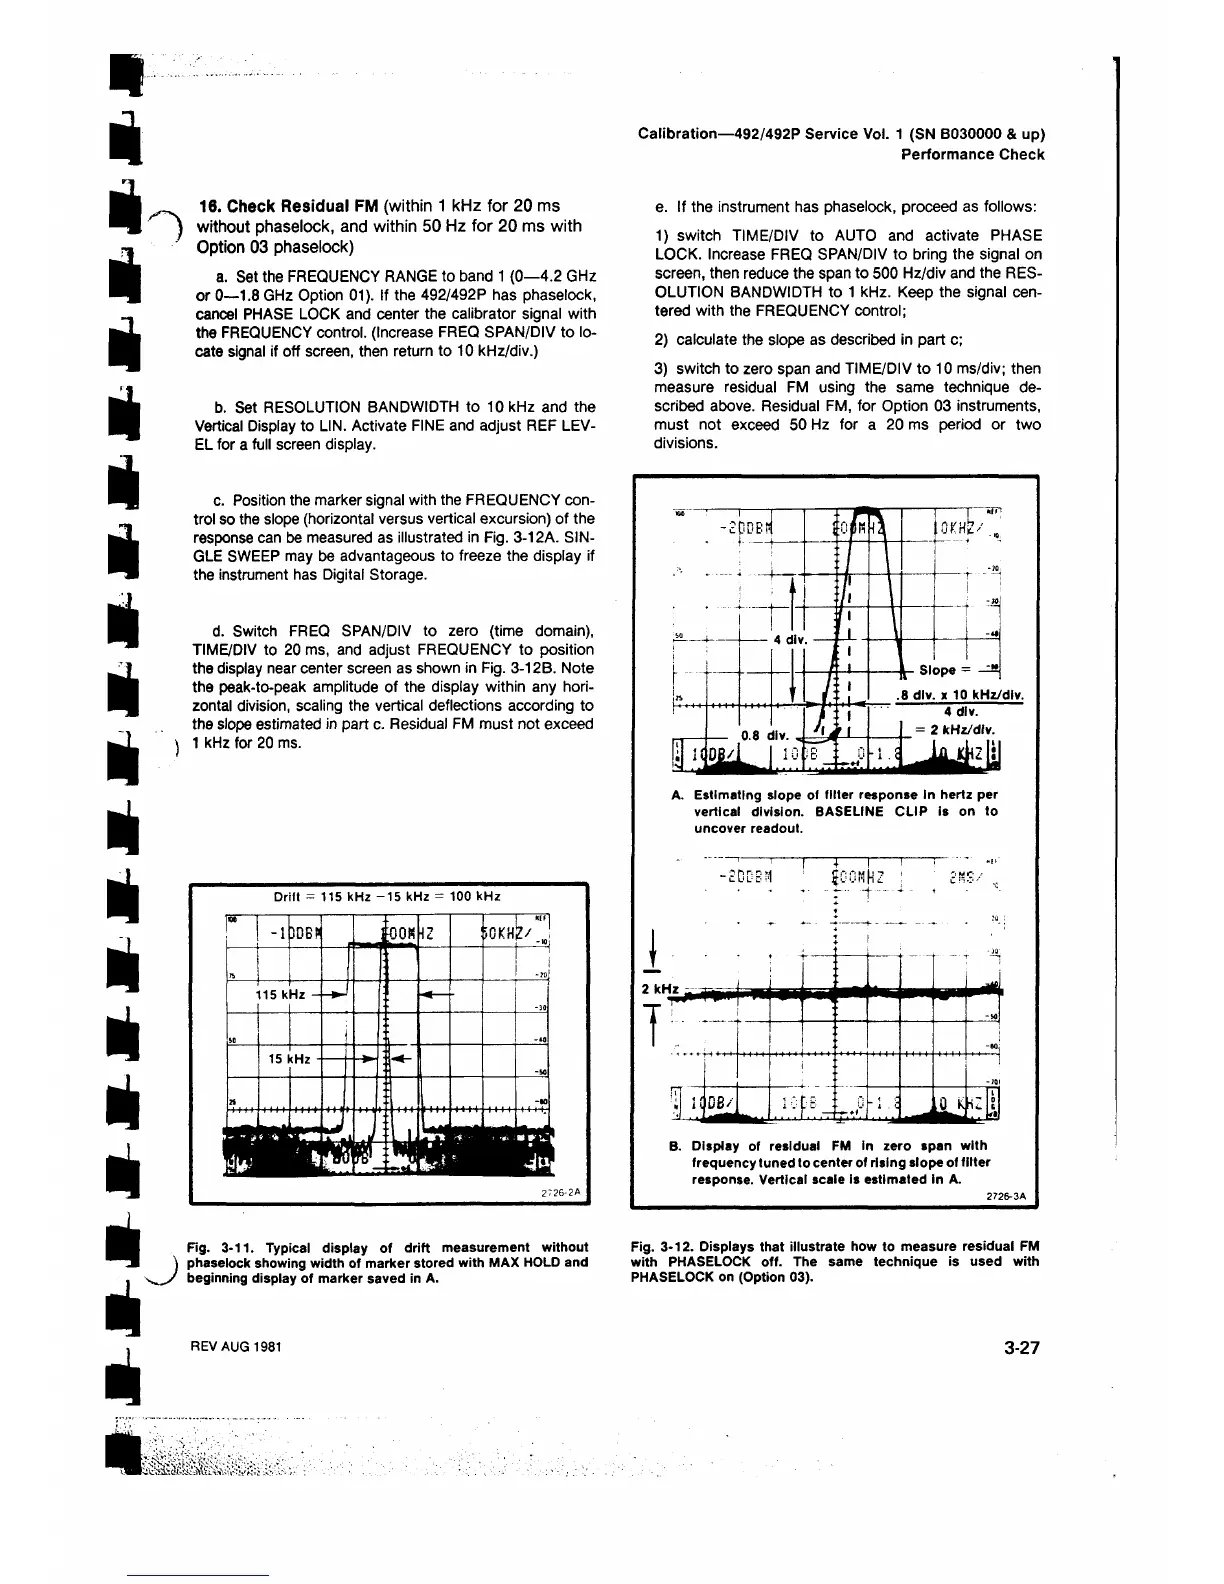
c. Position the marker signal with the FREQUENCY con
trol so the slope (horizontal versus vertical excursion) of the
response can be measured as illustrated in Fig. 3-12A. SIN
GLE SWEEP may be advantageous to freeze the display if
the instrument has Digital Storage.
d. Switch FREQ SPAN/DIV to zero (time domain),
TIME/DIV to 20 ms, and adjust FREQUENCY to position
the display near center screen as shown in Fig. 3-12B. Note
the peak-to-peak amplitude of the display within any hori
zontal division, scaling the vertical deflections according to
the slope estimated in part c. Residual FM must not exceed
1 kHz for 20 ms.
Drift = 115 kHz - 1 5 kHz = 100 kHz
«
-1
3DBP
H
OOS
t
>0KH
Mi
1
1
_
_______!
115 k
Hz -
t '
-
-30
SB
___
-4Q
15 I<Hz -
z t
K
-so
»
A
-• 0
IM V M N M I M M f l M l l W II M I I M I V P
— it -■%
'
M H r t j n i l r s i
V m * -* η·. ■ , ■ *
v
2
'2 6 - 2 A
Fig. 3-11. Typical display of drift measurement without
phaselock showing width of marker stored with MAX HOLD and
beginning display of marker saved in A.
Fig. 3-12. Displays that illustrate how to measure residual FM
with PHASELOCK off. The same technique is used with
PHASELOCK on (Option 03).
REV AUG 1981
3-27