RSA306 USB Real-Time Spectrum Analyzer Demo Guide
6
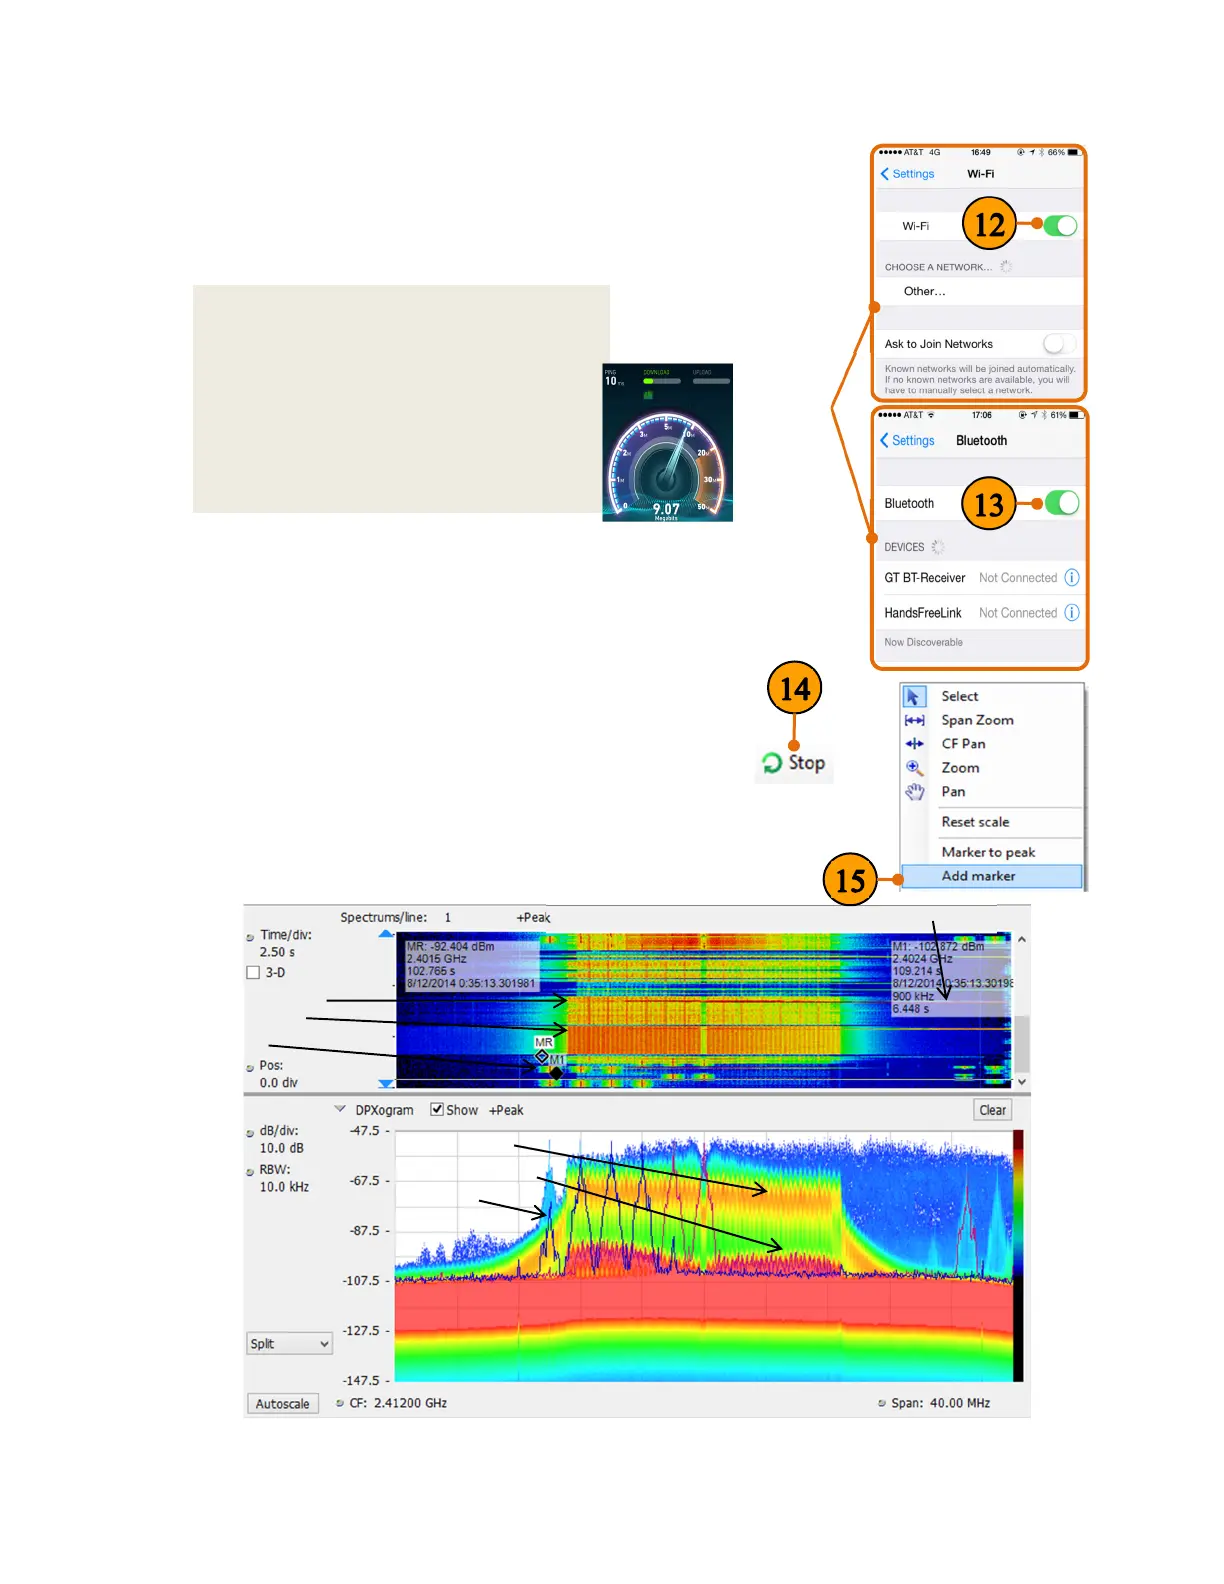
12. Turn the WLAN function Off, then On in your smart
phone/tablet/PC while monitoring the DPX display.
Check the DPX display to see if you can see the
spectrum of the WLAN signals. If no signal, you can
change the center frequency of the RSA306 to other.
13. Turn the Bluetooth function Off, then
On in your smart phone/tablet/PC while monitoring the
DPX display.
14. Click Stop to stop the acquisitions when you have a
pattern on the spectrogram you would like to examine.
15. Right click the display, and click Add markers twice to
add two markers. Then you can measure the distance
between hops in frequency and time using the markers
on the spectrogram.
You can see a typical WLAN interchange between a nearby
smart phone/tablet/PC and a more-distant network access point
(AP). The smart phone/tablet/PC signal is nearly 30 dB stronger
than the AP's signal because it is closer to measurement
antenna. At the same screen, you can also see the Bluetooth
signals, and even the measurements of the time and frequency
intervals between those hop signals.
DownlinkWLAN
UplinkWLAN
Bluetooth
DownlinkWLAN
UplinkWLAN
Bluetooth
Distancebetweenhopsinfrequencyandtime
Quick Tip: Wi-Fi Test mode
To have a better observation of the WLAN
activities in the DPX display. You can
cause both uplink and downlink activity on
your device by navigating to an “internet
speed testing” webpage to test both the
uploading and downloading speed, and
monitor the DPX display of the RSA306 at
the same time.
On your
smart
phone,
tablet, or
PC
 Loading...


