Kutzler & Kokol-Voljc: Introduction to D
ERIVE
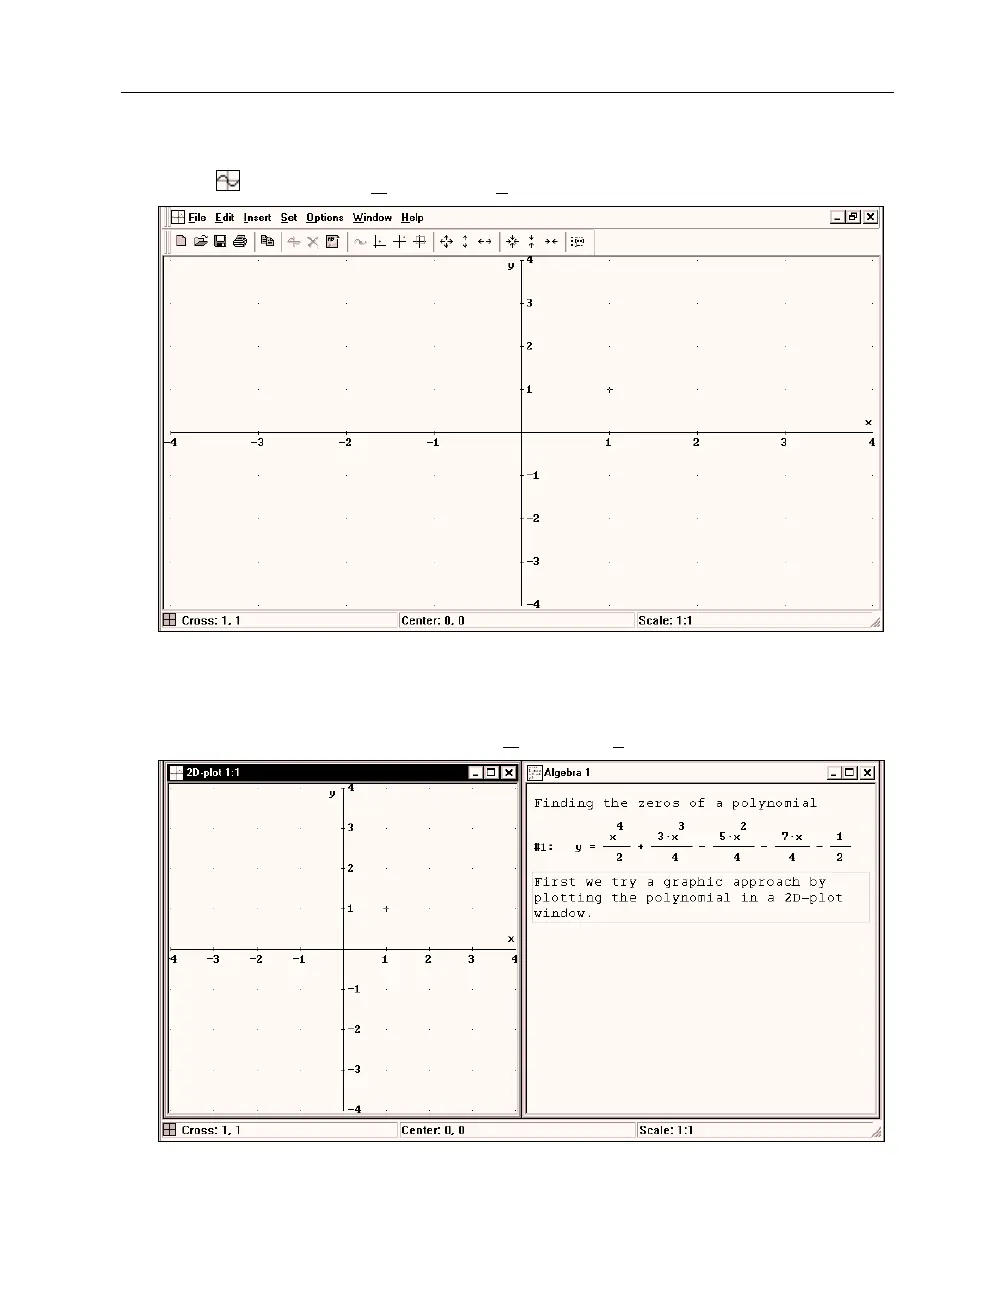
525
Prepare for plotting a 2D graph: Open a 2D-plot window by clicking on the
2D-plot Window
button
or selecting the
Window>New 2D plot Window
command.
D
ERIVE
created a plot window, so that you now have two windows to work with: an algebra
window and a 2D-plot window. Use the usual W
INDOWS
techniques to flip between windows or
change their sizes and positions.
Put the two windows side by side using the
Window>Tile Vertically
command.
Each window is labeled with the window type in its upper left corner (
2D-plot
and
Algebra
). The
active window’s Title Bar is dark; the inactive window’s Title Bar is dimmed. Since the plot
window is active, the Menu Bar, the Command Toolbar, and the Status Bar are all different from