Do you have a question about the Texas Instruments TI-86 and is the answer not in the manual?
Installs four AAA alkaline batteries and explains the lithium backup battery.
Explains how to turn the calculator on and off using the ON and OFF keys.
Details how to adjust the screen contrast using the yellow 2nd key and arrow keys.
Guides users on how to interpret error messages and correct them.
Lists and explains the mathematical functions available on the TI-86 keyboard.
Details calculus functions like derivatives, integrals, min/max, and arc.
Explains relational functions for comparisons in expressions and instructions.
Outlines the process for graphing functions in Func mode.
Explains how to display the mode screen and select graphing modes.
Guides on displaying and using the equation editor to enter functions.
Explains how to define graph screen window boundaries like xMin, xMax, yMin, yMax.
Describes how to set graph format options for display characteristics.
Explains how to display the plotted graph and manage its viewing.
Details how to use the trace cursor to move along a graph and view coordinates.
Explains how to use ZOOM operations to change window variable values.
Describes how the table displays independent and dependent values for selected functions.
Explains how to set up the table using TblStart and DeltaTbl.
Explains steps for defining polar graphs, similar to function graphs.
Explains steps for defining parametric graphs, similar to function graphs.
Explains how to define differential equation graphs, noting differences from function graphs.
Guides on entering and solving differential equations, including SlpFld and DirFld formats.
Details methods for creating, storing, and displaying lists directly or via names.
Explains creating vectors in the editor or on the home screen.
Details creating matrices in the editor or on the home screen.
Explains analyzing one- and two-variable statistical data stored in lists.
Guides on entering data, calculating variables, and fitting models for analysis.
Explains how to plot scatter plots, xyLine, histograms, and box plots.
Guides on entering and editing equations using the equation-entry editor.
Explains setting up the editor with variable values, bounds, and guesses.
Details how to solve equations by moving the cursor to the unknown variable and selecting SOLVE.
Explains creating programs with expressions, instructions, and I/O commands.
Guides on how to paste and run programs from the PRGM NAMES menu.
Explains how to check RAM and monitor memory allocation using the MEM menu.
| Category | Graphing Calculator |
|---|---|
| Manufacturer | Texas Instruments |
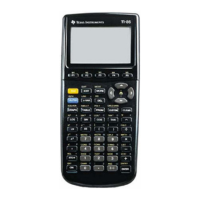
| Model | TI-86 |
| Display Type | LCD |
| Display Resolution | 128 x 64 pixels |
| Processor | Zilog Z80 |
| Processor Speed | 6 MHz |
| Memory | 128 KB RAM |
| Battery Type | 4 x AAA |