116
Chapter 8: Polar Graphing
08POL.DOC TI-86, Chap 8, US English Bob Fedorisko Revised: 02/13/01 2:26 PM Printed: 02/13/01 3:02 PM Page 116 of 808POL.DOC TI-86, Chap 8, US English Bob Fedorisko Revised: 02/13/01 2:26 PM Printed: 02/13/01 3:02 PM Page 116 of 808POL.DOC TI-86, Chap 8, US English Bob Fedorisko Revised: 02/13/01 2:26 PM Printed: 02/13/01 3:02 PM Page 116 of 8
Preview: Polar Graphing
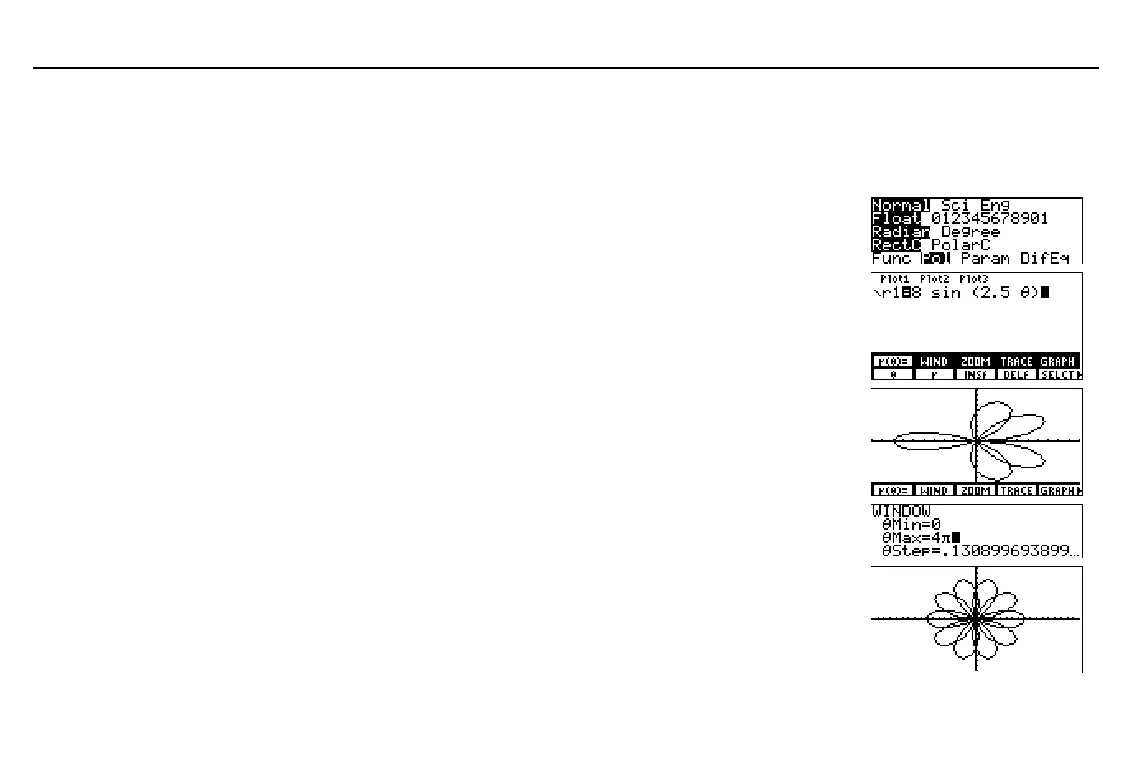
The graph of the polar equation A sin (B
q
) forms the shape of a flower. Graph the flower for
A=8 and B=2.5. Then explore the appearance of the flower for other values of A and B.
Select
Pol
mode from the mode screen.
-
m
#
#
#
#
"
b
Display the equation editor and polar
equation editor menu.
(Deselect or delete all equations if any.)
Store
r1(
q
)=8sin(2.5
q
)
.
6
&
(
/
'
/
)
8
=
D
2
`
5
&
E
Select
ZSTD
from the
GRAPH
ZOOM
menu.
r1
is plotted on the graph screen.
-
g
)
Display the window editor, and then
change
q
Max
to
4
p
.
'
#
4
-
~
Select
ZSQR
from the
GRAPH
ZOOM
menu.
xMin
and
xMax
are changed to
display the graph in correct proportion.
Change the values of A and B and
redisplay the graph.
(
/
'
&
(enter other A
and B values)
To remove the
GRAPH
menu
from the graph screen, as
shown, press
:
.
To redisplay the
GRAPH
menu, press
6
.