196
Chapter 14: Statistics
14STATS.DOC TI-86, Chap 14, US English Bob Fedorisko Revised: 02/13/01 2:33 PM Printed: 02/13/01 3:04 PM Page 196 of 1414STATS.DOC TI-86, Chap 14, US English Bob Fedorisko Revised: 02/13/01 2:33 PM Printed: 02/13/01 3:04 PM Page 196 of 1414STATS.DOC TI-86, Chap 14, US English Bob Fedorisko Revised: 02/13/01 2:33 PM Printed: 02/13/01 3:04 PM Page 196 of 14
The PLOT TYPE Menu (Selecting a Plot Type)
PLOT1 PLOT2 PLOT3 PlOn PlOff
SCAT xyLINE MBOX HIST BOX
At this prompt... Enter this information: Default is: Displayed menu is:
Xlist Name=
independent-data list name
xStat
LIST
NAMES
menu
Ylist Name=
dependent-data list name
yStat
LIST
NAMES
menu
Freq=
frequency list name (or
1
)
fStat
(default value:
1
)
LIST
NAMES
menu
Mark=
plot mark (
›
or
+
or
¦
)
›
(none for
HIST
or
BOX
)
PLOT MARK
menu
♦
Any list you enter at the
Xlist Name=
prompt is stored to the list name
xStat
.
♦
Any list you enter at the
Ylist Name=
prompt is stored to the list name
yStat
.
♦
Any list you enter at the
Freq=
prompt is stored to
fStat
.
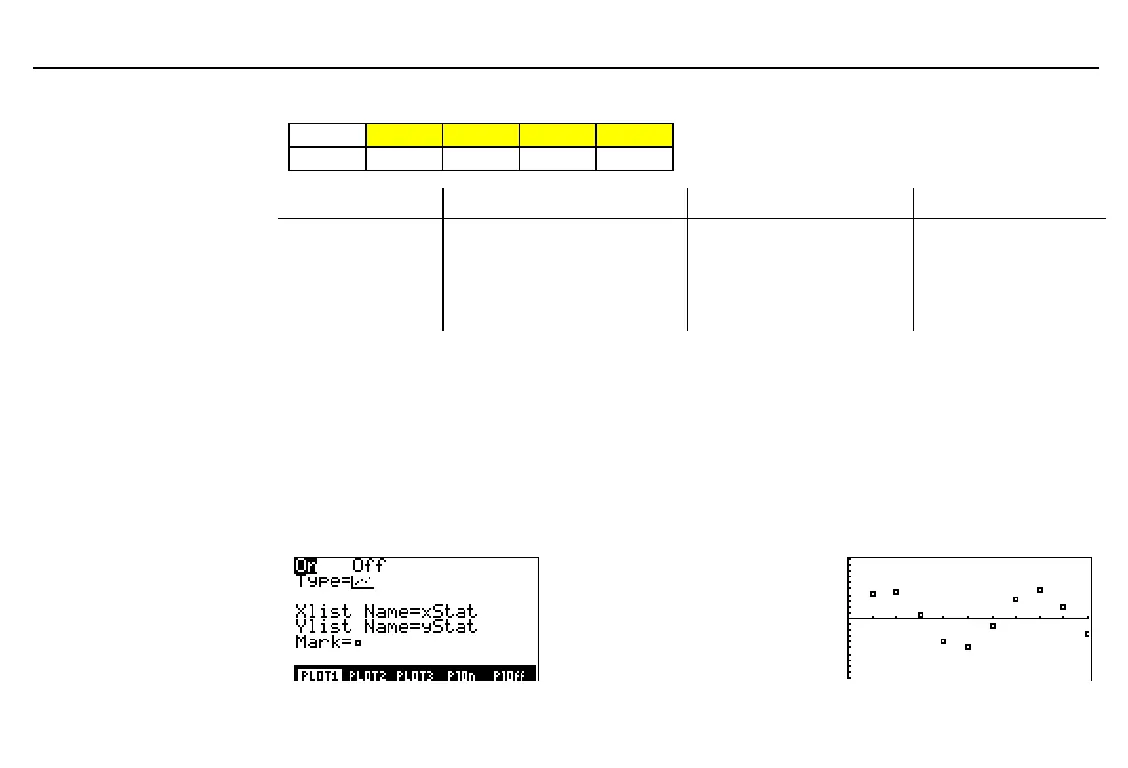
Plot Type Characteristics
®
SCAT
(scatter plot) plots the data points from
Xlist Name
and
Ylist Name
as coordinate
pairs, representing each point with a box (
›
), cross (
+
), or dot (
¦
) mark type.
Xlist Name
and
Ylist Name
must be the same length.
Xlist Name
and
Ylist Name
can be the same list.
For the example:
xStat={1 2 3 4 5 6 7 8 9 10}
yStat=5 sin(xStat)
Window variable values:
xMin=0
yMin=
L
10
xMax=10
yMax=10
To display the
PLOT
TYPE
menu, move the cursor onto
the plot type icon at the
Type=
prompt.
When you select a plot type,
the appearance of the stat
plot editor may change.
Stat plots are displayed on
the graph screen
(
6
*
)
,
as defined by the window
variable values (Chapter 5).
Some graph tools apply to
stat plots.
In these stat plot examples,
all functions are deselected.
Also, menus are cleared from
the screen with
:
.