Kutzler & Kokol-Voljc: Introduction to D
ERIVE
529
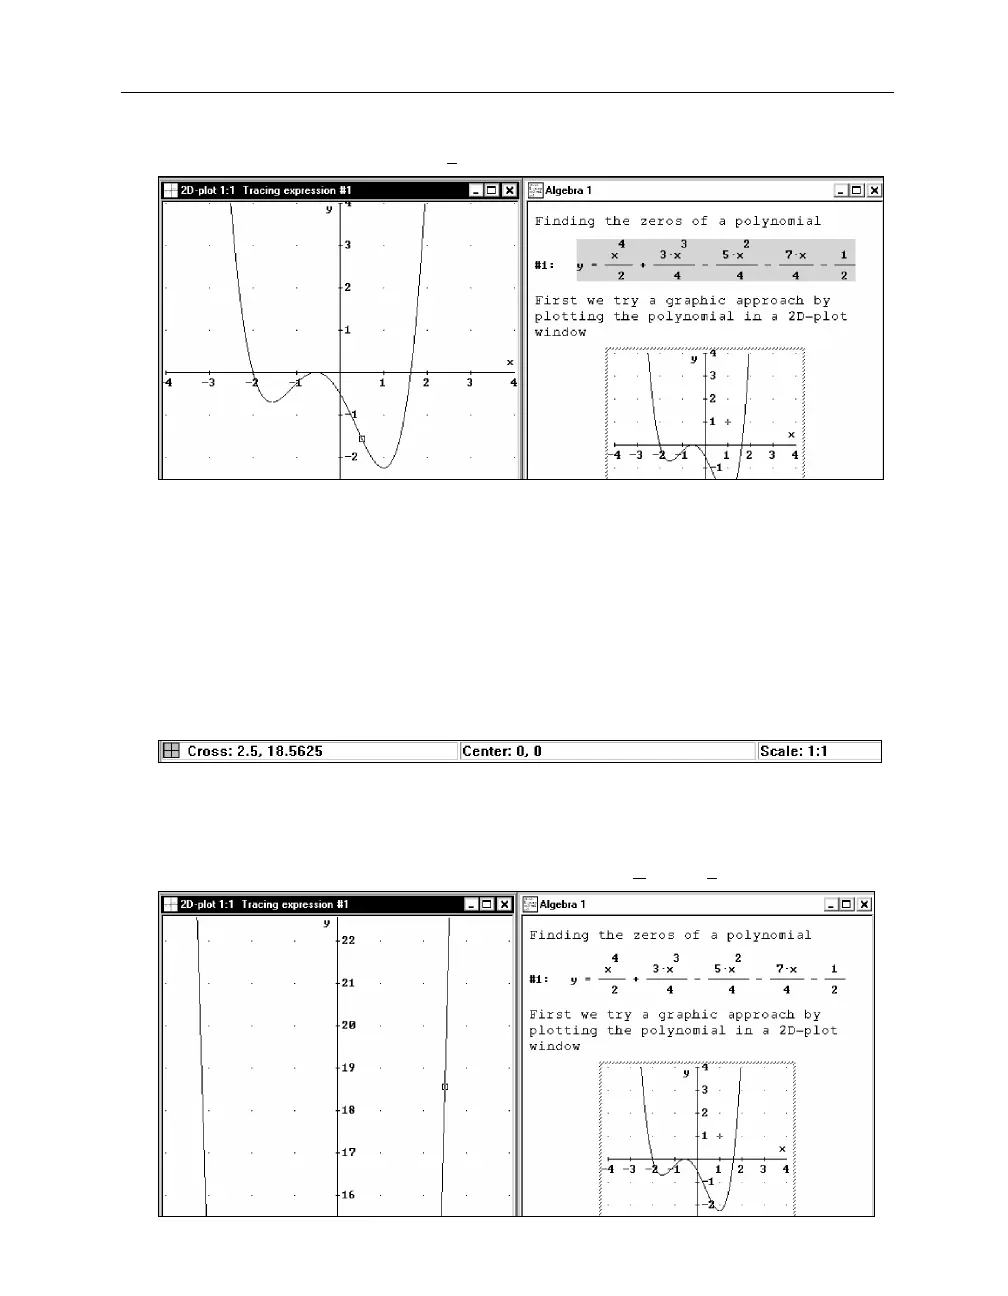
Turn trace mode on by selecting the
Trace Plots
command.
When trace mode is switched on, the cross changes its shape into a square and jumps vertically
to the curve, with its horizontal coordinate unchanged. The expression number of the traced
curve is displayed in the plot window’s Title Bar (here:
Tracing Expression #1
). When trace
mode is switched on, the square can be moved only along the curve. This can be done using
(Æ)
and
(æ)
, or using
(Ctrl)
+
(Æ)
and
(Ctrl)
+
(æ)
for “big steps.” It can also be done by moving
the mouse pointer and clicking with the left mouse button to the new position. If there are
several graphs displayed, use
(½)
and
(¼)
to select another graph.
Become familiar with moving the square. Use the arrow keys and the mouse to move the
square. Finally, click the left mouse button at the point (2.5,0).
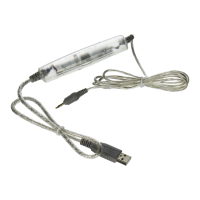
What happened to the square? It disappeared. Looking at the status line indicates the reason. The
square’s vertical coordinate is 18.5625, so it is far from the current plot area. You can ask D
ERIVE
to move the plot area where the cross or square is.
Move the plot area where the cross is by flipping the switch
Options>Follow Cross
.