30 Chapter 2: Documenting Polynomial Zero Finding
The plot window “follows” the square. This means that the plot ranges for the horizontal and the
vertical axes are changed automatically to ensure that the cross is visible. Since this mode can
destroy a chosen plot range, follow mode should be used carefully and is therefore switched off
by default.
Turn follow mode off by selecting
Options>Follow Cross
again.
There are several ways to restore a previous range:
•
While follow mode is on, you can click the left mouse button at a horizontal position where
the corresponding vertical curve coordinate is within the original plot range. This requires
some knowledge and reasoning about the curve.
•
Independent of the follow mode status you may use the
Center on origin
button .
•
Select the
Set>Plot Range
or the
Set>Plot Region
command, use the
(_Reset_)
button,
then leave the dialog.
•
If available, double click on an embedded version of the original graph. This last option is
particularly convenient.
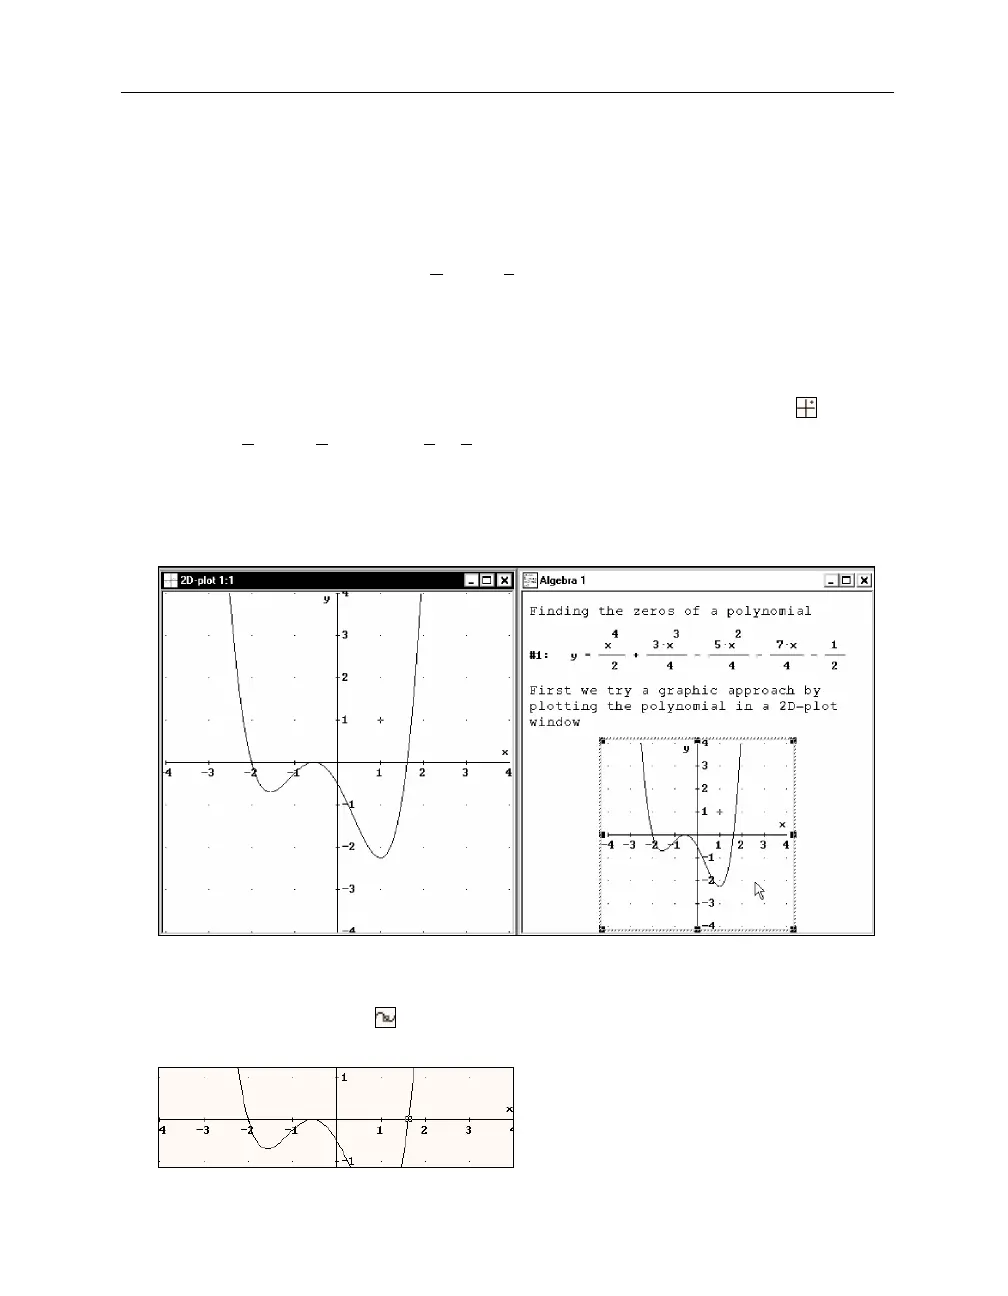
Restore the original graph by double clicking on the embedded graph.
Trace mode was lost because the embedded graph was produced before trace mode was turned
on. Switch trace mode on again to start looking for the polynomial’s zeros.
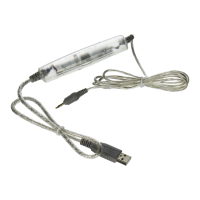
Switch trace mode on with
, then move the square to the rightmost zero, as near as you
can get to the horizontal axis.
D
ERIVE
displays the square coordinates as
Cross: 1.62, 0.01688368
. (Your numbers might be
different.) Using the left arrow key
(æ)
once moves the square to
Cross: 1.6, -0.1512
. You have