Chapter 4: Linear Inequalities Name
Section 1: Using Graphs & Tables Date
Topics in Algebra 1 © 2001 Texas Instruments Student Worksheet 4-4
³
Try-It!
é
on Your TI
.
83 Plus or TI
.
73
Solution search using X-Y graphs:
Find the solution set for the inequality
X
−
1<1
. Before you start,
estimate the solution using number sense. Write your estimate here.
To Do This Press Display
(TI
.
83 Plus shown)
1. Exit the Topics in Algebra 1
application and clear the Home
screen.
y
l
á
EXIT
â
:
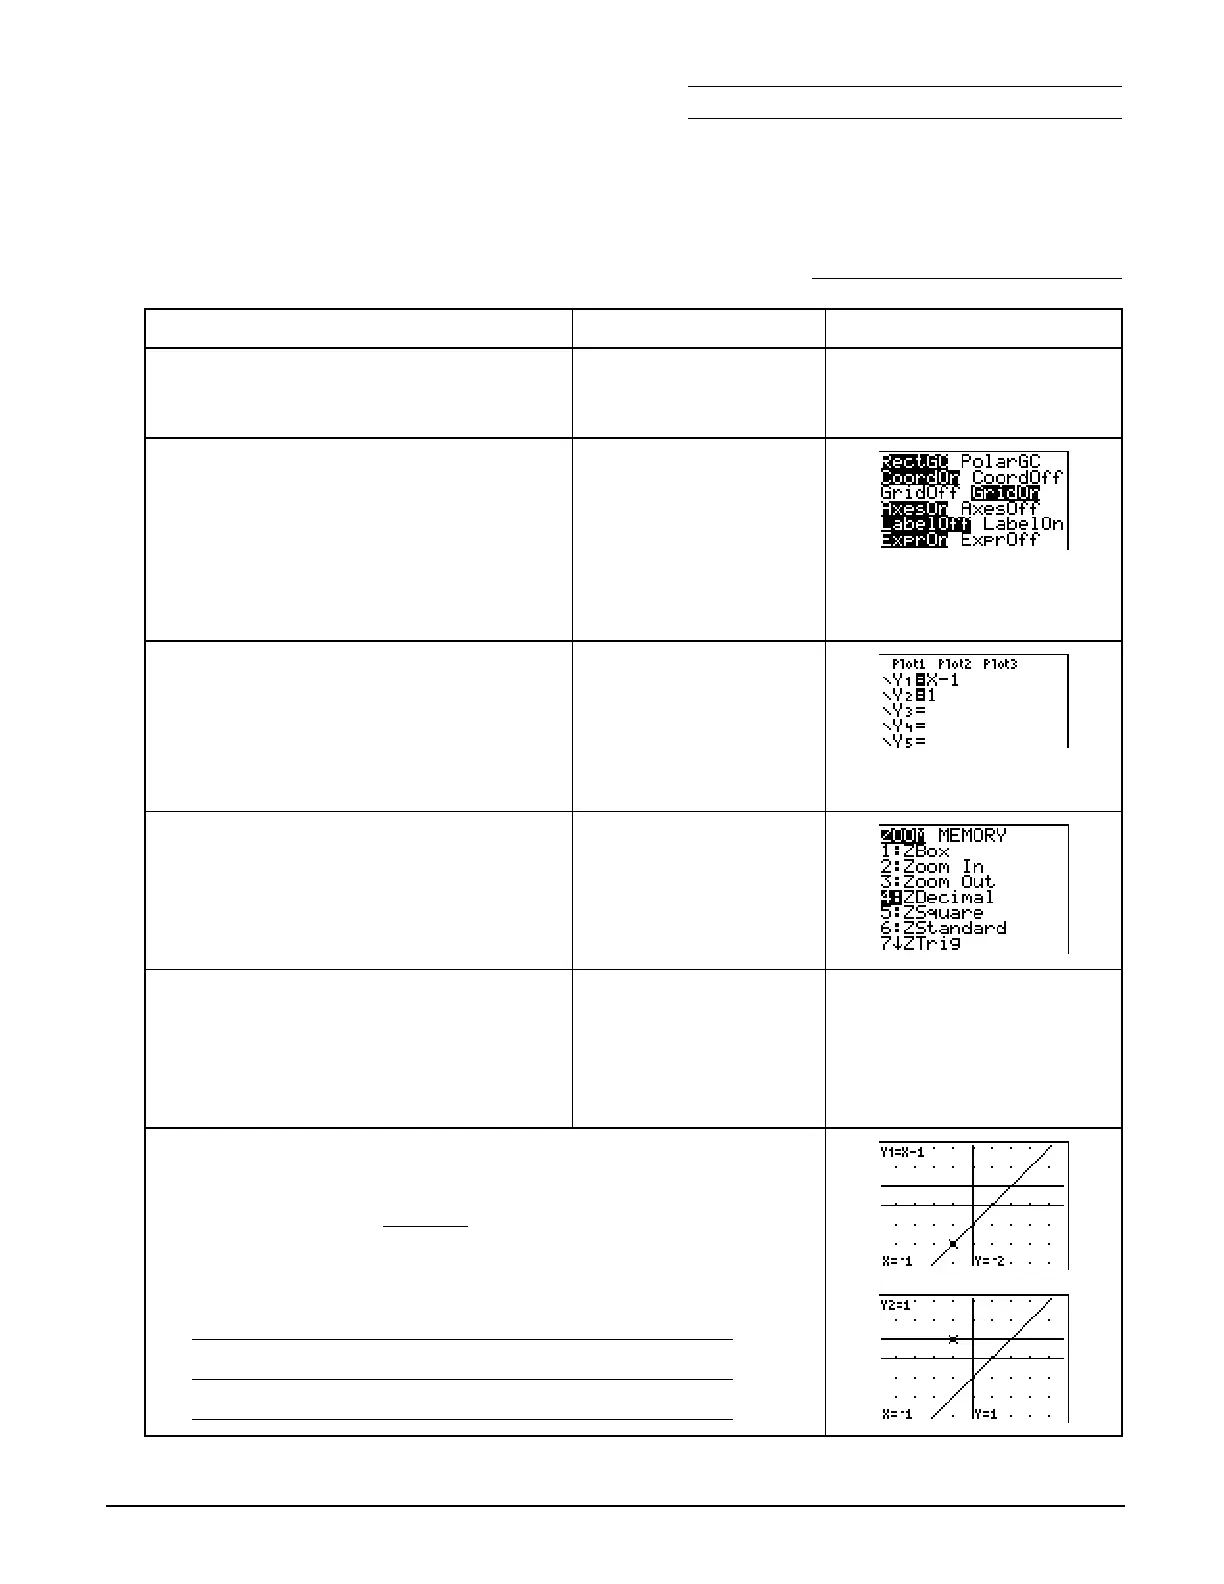
2. Set your window format as shown.
Note:
See
³
TIp
é
5:
Adjusting the Viewing Window
for more information.
TI
-
83:
-
g
#
#
"
b
TI
-
73:
-
g
#
"
b
3. Enter both sides of the inequality into
the Y= editor as shown.
Note
: On the TI
-
73, use
I
rather than „.
Note
: You may need to deselect the other Y=
functions. See
³
TIp
é
3:
Graphing a Function in the
Standard Window
.
&
:
„
T
1
#
:
1
4. Select
ZDecimal
to set the viewing
window and graph the functions.
TI
-
83:
(
4:ZDecimal
TI
-
73:
(
8:ZDecimal
5. Trace the functions.
Note
: The function displays in the upper left corner
of the screen; the
X
and
Y
values are displayed on
the bottom of the screen.
r
| or ~ to trace a
function
} and † to move
between functions
6. Compare
Y
1
and
Y
2
for the same
X
values. For example, notice
that when
X =
M
1
,
Y
1
=
M
2
and
Y
2
=1
as shown on the screens.
Where is
X
−
1 < 1
?
Hint
: Trace
Y1
to find out when
Y1
<
Y2
.
7. Why?

 Loading...


