Chapter 4: Linear Inequalities Section 1: Using Graphs & Tables
Topics in Algebra 1 © 2001 Texas Instruments Teacher Notes 4-10
³
Try-It!
é
on Your TI
.
83 Plus or TI
.
73
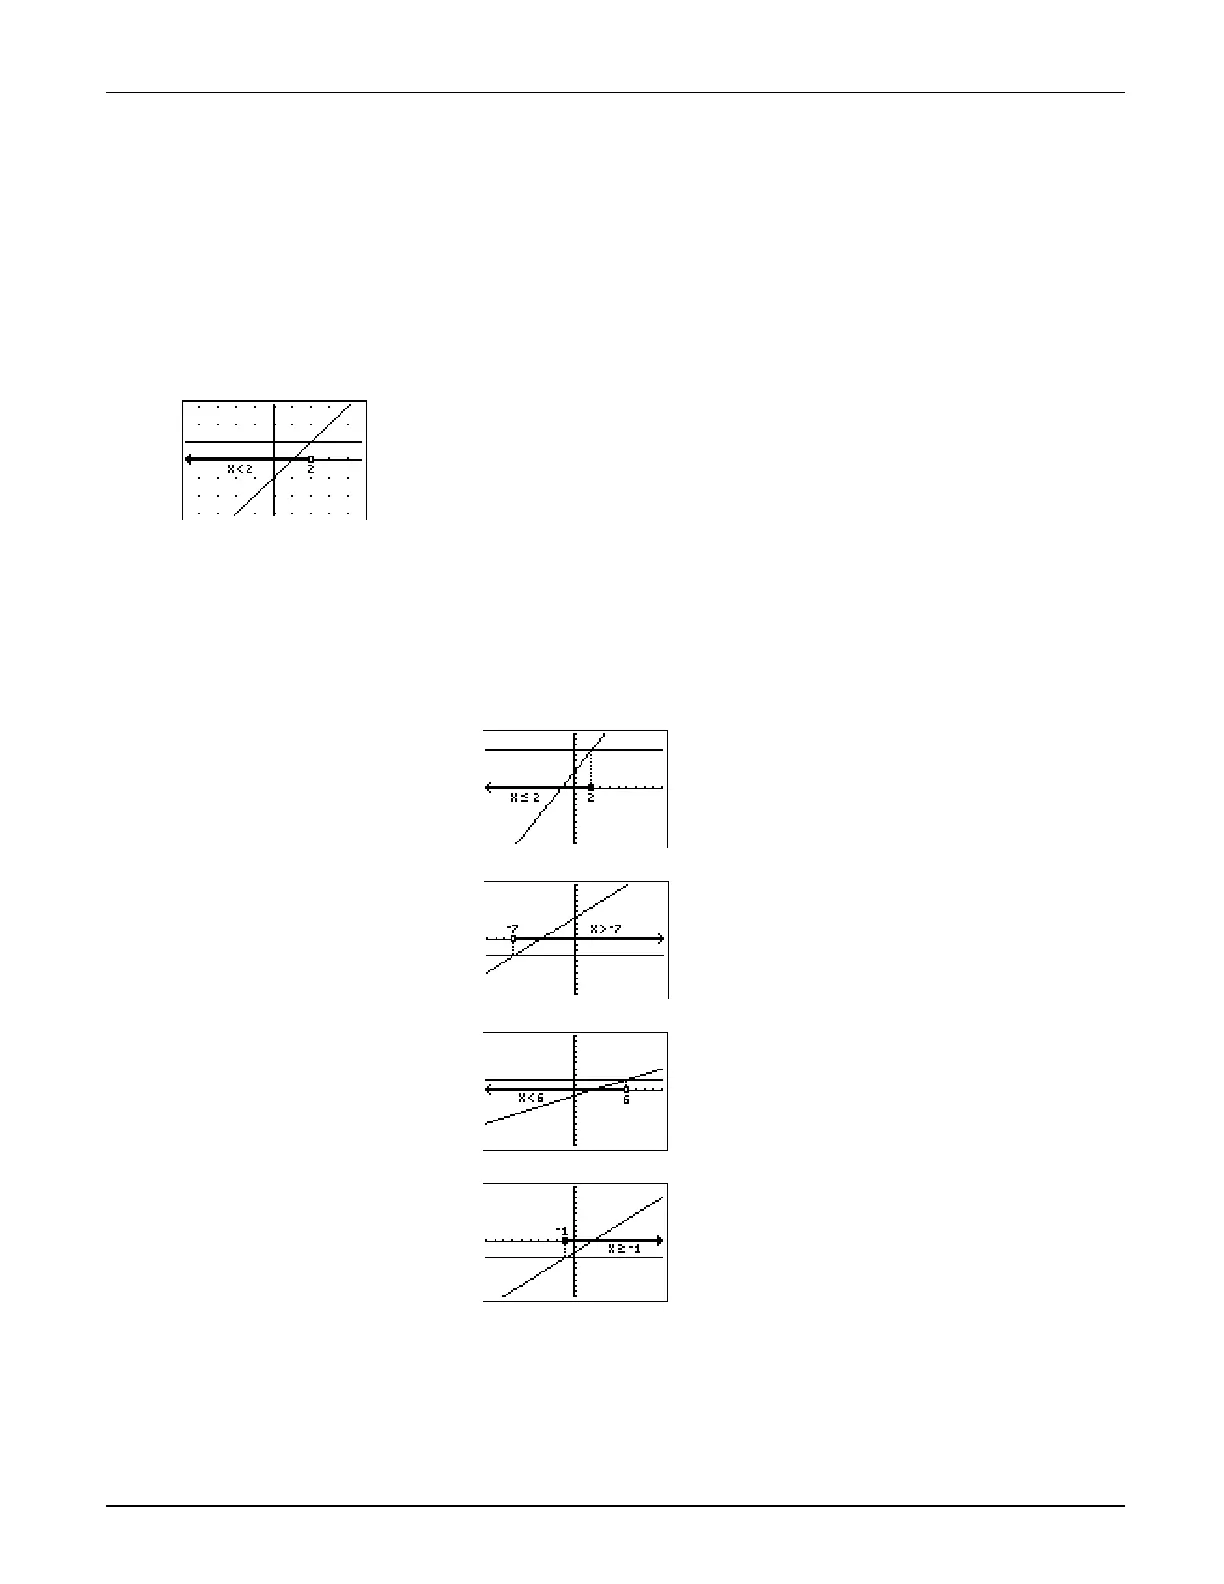
Solution Search Using X-Y Graphs:
Tell students to first estimate the solution for the inequality
X
−
1<1
using number sense and then find the solution set using a calculator.
6.
X
−
1
< 1
when
X<
2
.
7.
Answers may vary
. Students can trace the graph to see the result.
Additional Problems
Students investigate inequalities using
X-Y
graphs to compare numbers in order to create the
solution set. See the student worksheet for calculator details. Students must set appropriate
graphing windows in order to see the graphs. Graphing windows shown use
(
ZStandard
,
which sets
X
and
Y
values so that
M
10
≤
value
≤
10
.
1.
2X+3
7
2.
X+4
>
M
3
3.
0.5X
N
1
<
2
4.
X
N
2
‚
M
3

 Loading...


