³
TIp 3: Graphing a Function in the Standard Window
Topics in Algebra 1 © 2001 Texas Instruments
³
TIp 3-3
³
Try-It!
é
on Your TI
.
83 Plus or TI
.
73
(continued)
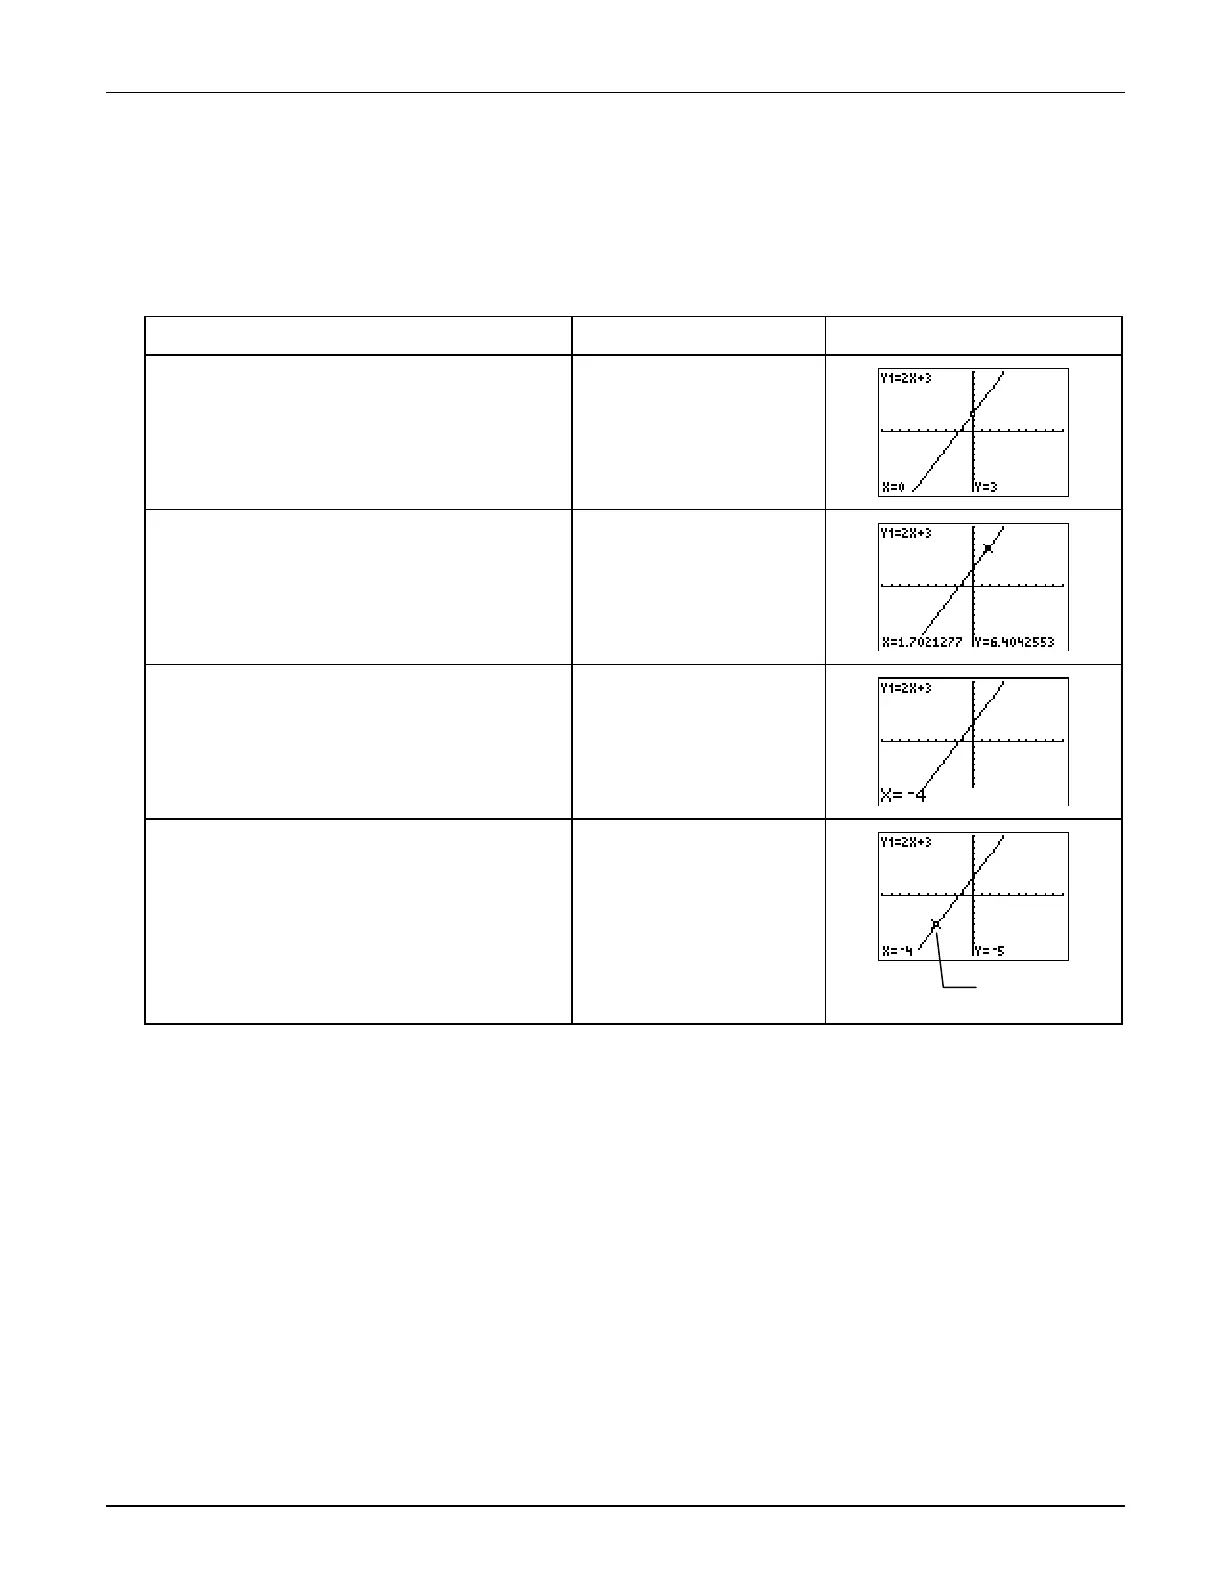
Trace the Graph
Trace the (
X
,
Y
) values for
Y1=2X+3
on the graph screen.
To Do This Press Display
(TI-83 Plus shown)
1. Enter trace mode.
)
2. Trace the (
X
,
Y
) values along the
graph.
X
and
Y
values display at the bottom
of the screen.
"
and
!
3. Quickly find
Y
when
X=
M
4
.
a
4
4. Notice that when
X=
M
4
then
Y=
M
5
.
b
On Your Own
³
Display a grid on the graph screen by selecting
GridOn
in the window format screen
(
-
g
).
³
Define
Y
2
=
M
X+6
.
³
Graph
Y
1
=2X+3
and
Y
2
=
M
X+6
at the same time and compare. Now trace along each function
to find the point of intersection. Record the point of intersection.
Hint:
Use
#
and
$
to move between functions.
³
Graph
Y
2
only.
Hint:
You must deselect
Y
1
so that the calculator does not graph it. To deselect
Y
1
, highlight its equal sign (
=
) in the Y= editor with
the cursor, and then press
b
. Notice the equal sign is no longer highlighted.
Cursor moves
to (
L
4,
L
5).

 Loading...


