³
TIp 4: Creating a Table
Topics in Algebra 1 © 2001 Texas Instruments
³
TIp 4-3
³
Try-It!
é
on Your TI
.
83 Plus or TI
.
73
(continued)
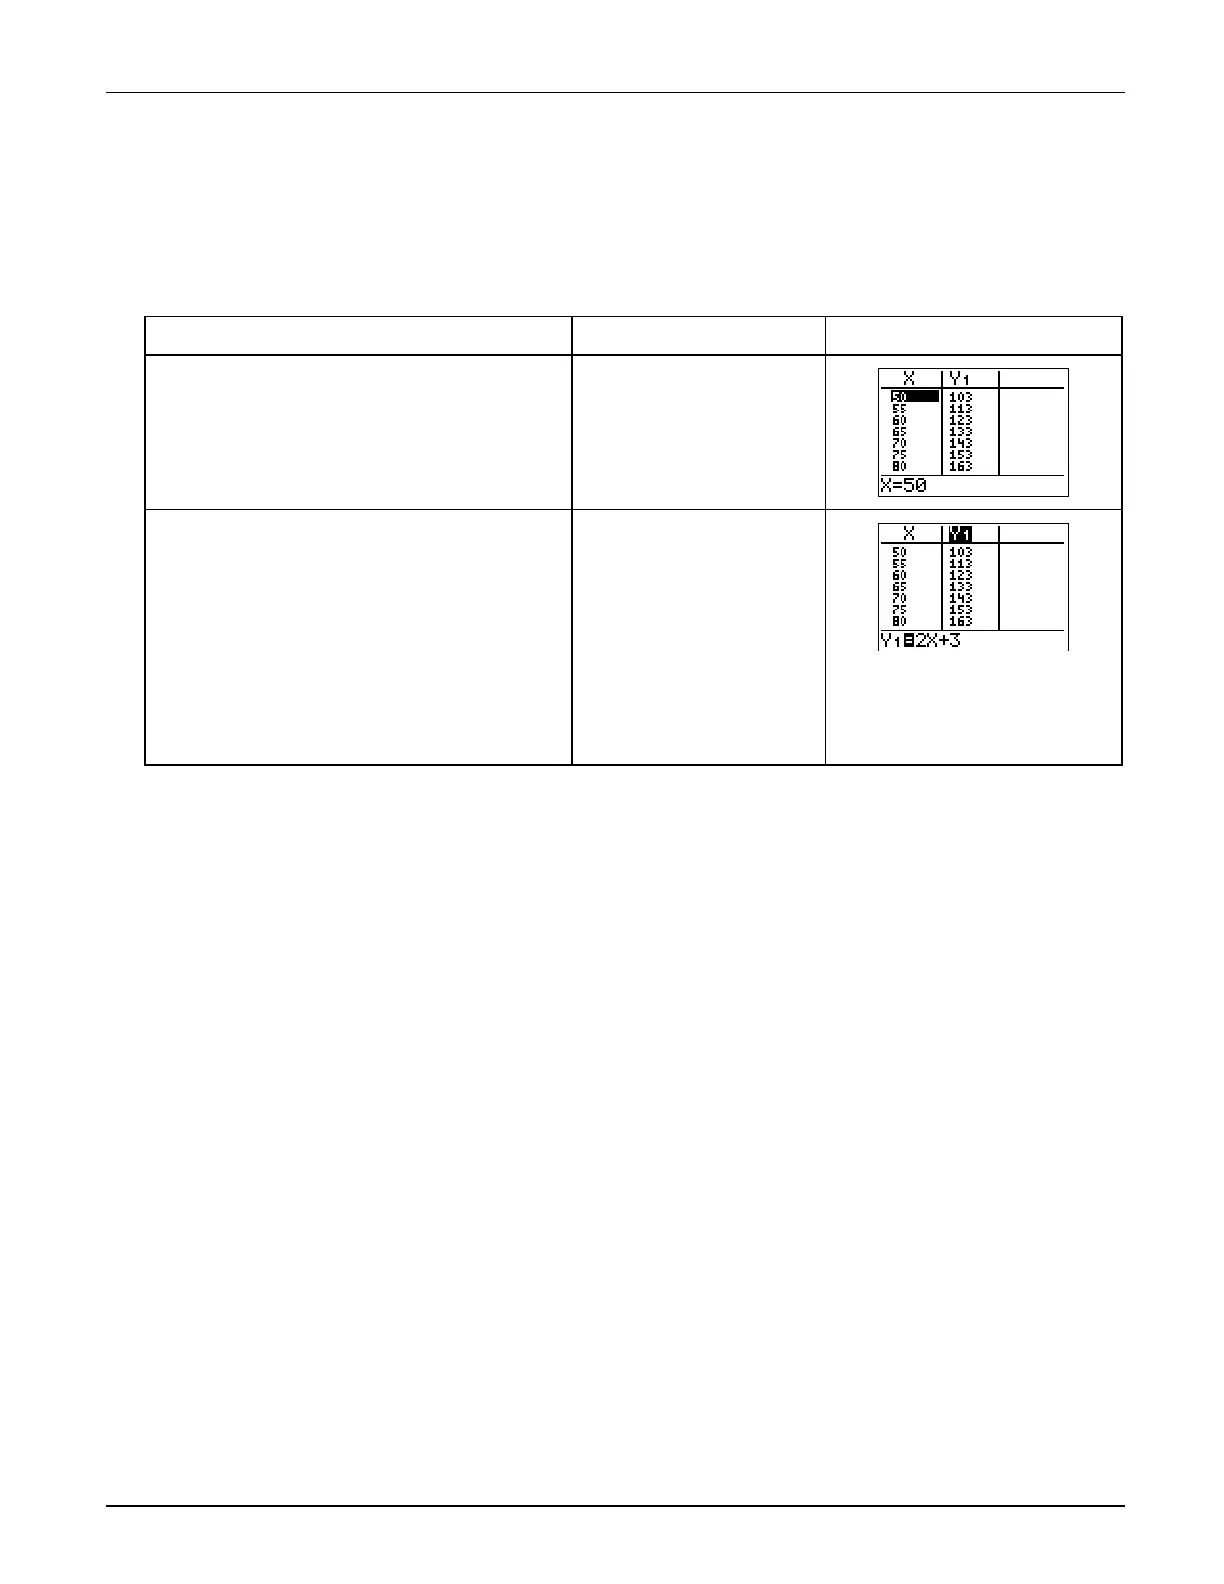
Display the Table
Display the table for
Y
1
=2X+3
on the graph screen.
To Do This Press Display
(TI-83 Plus shown)
1. Display the table.
-
i
2. Scroll through the table values with
the arrow keys.
Note:
Notice that when you press
$
and move to
the top of the
Y
1
column, the cursor moves to
Y
1
instead of displaying
Y
-values that are off the
screen. The function is displayed on the edit line
and can be changed.
!
,
"
,
#
, or
$
as necessary
On Your Own
³
Try to display more (
X,Y
) values. Set
@
Tbl=1
(pronounced “delta table”) and display the table
again. Then set
@
Tbl=.1
and display the table. Notice how the table values differ.
³
Enter
Y
2
=
M
X+6
in the Y= editor. Display the table of values for both
Y
1
and
Y
2
. Is
Y
1
ever equal
to
Y
2
?
Hint:
Set
TblStart=0
and
@
Tbl =1
and search through the table.
³
Change the mode (
.
) setting from
Normal
to
Sci
. Display the table. Notice how this
affects the table values.
³
Go to the table setup screen and figure out what the
Depend: Ask
setting does.
Hint
: To reveal an invisible
Y
value in the table, place the cursor on that space and press
b
.

 Loading...


