³
TIp 7: Creating a Statistical Plot
Topics in Algebra 1 © 2001 Texas Instruments
³
TIp 7-3
³
Try-It!
é
on Your TI
.
83 Plus or TI
.
73
(continued)
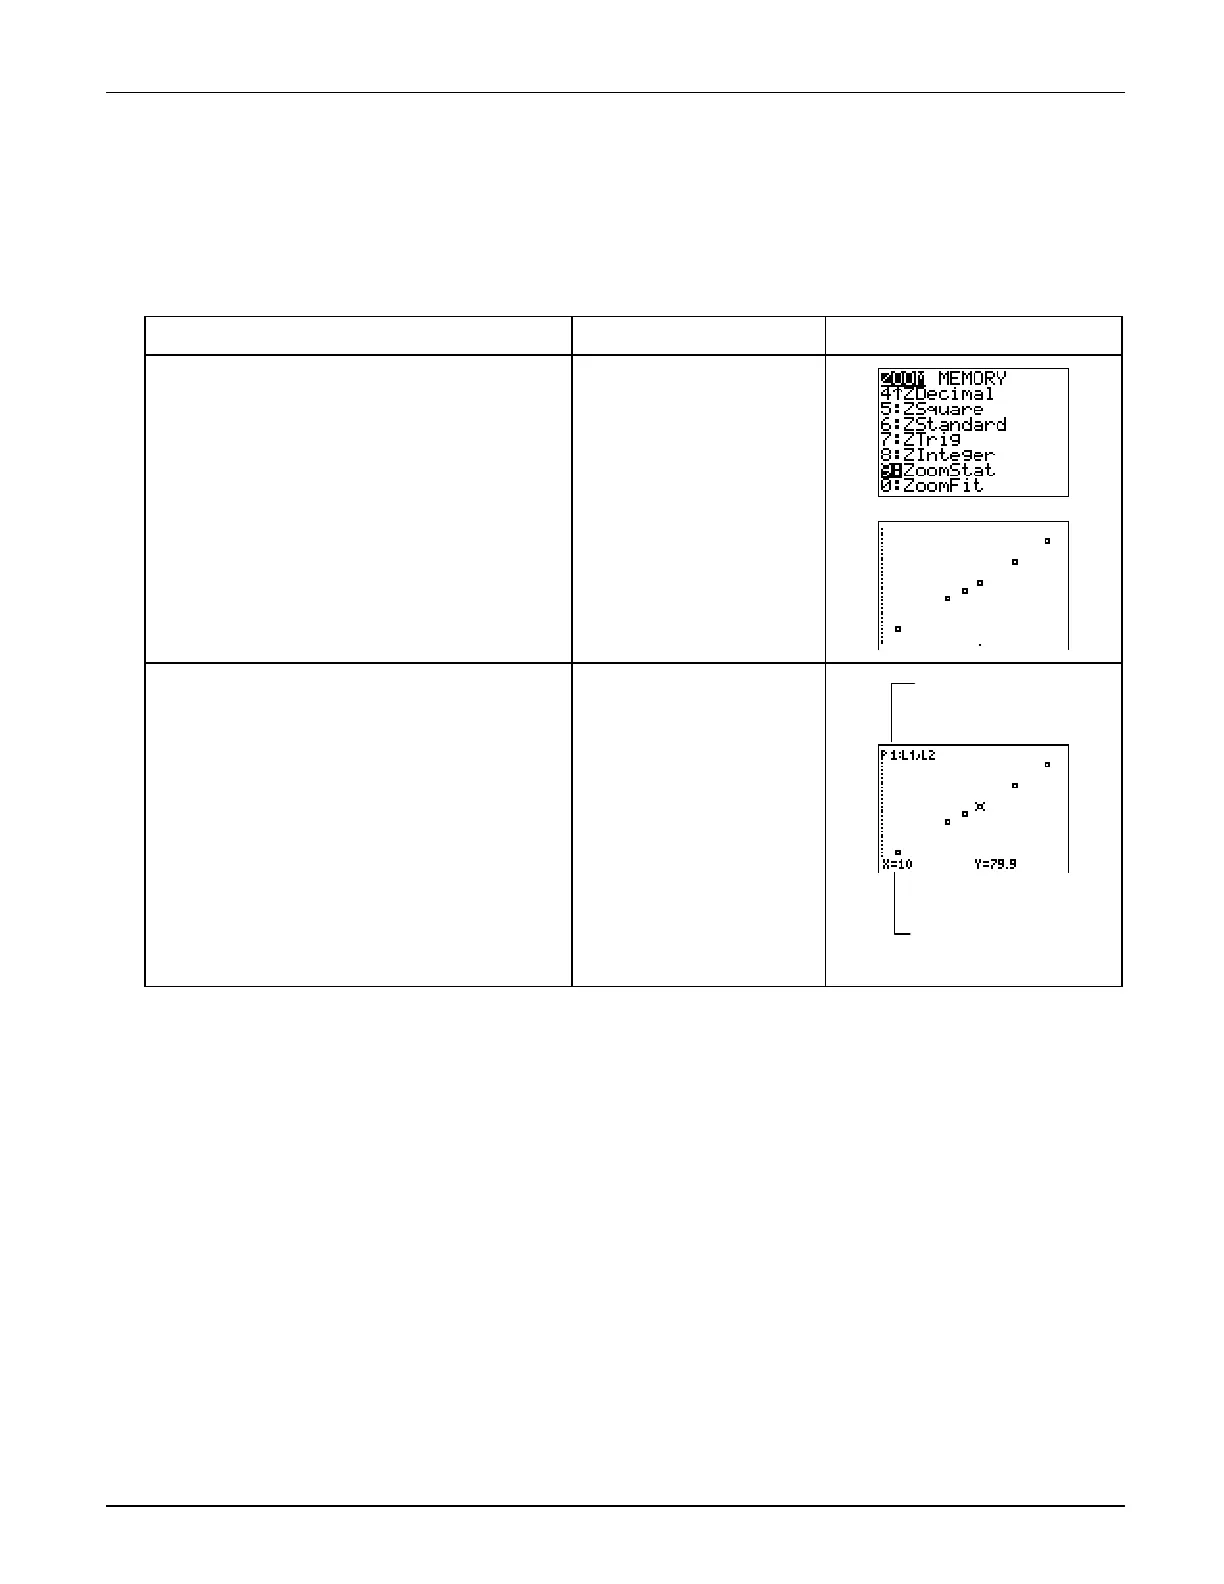
Display the Statistical Plot on the Graph Screen
Display the statistical plot on the graph screen using the
ZoomStat
command and trace it.
To Do This Press Display
(TI-83 Plus shown)
1. Select
ZoomStat
from the
ZOOM
menu.
TI
-
83 Plus:
(
9:ZoomStat
TI
-
73:
(
7:ZoomStat
2. Trace along the statistical plot.
Note:
P1:L
1
,L
2
in the upper left corner shows that
the lists
L
1
and
L
2
contain the data for the graph.
The data points are displayed at the bottom of the
screen.
)
"
or
!
as necessary
L
1
and
L
2
contain the
data for this graph.
(
X,Y
) coordinates of
the data point at the
cursor location.
 Loading...


