Chapter 3: Linear Functions Name
Section 1: Slope with Grid Date
Topics in Algebra 1 © 2001 Texas Instruments Student Worksheet 3-3
³
Try-It!
é
on Your TI
.
83 Plus or TI
.
73
Draw a line segment with endpoints at (
M
2,2) and (3,
M
2). Use the
Line(
command, which draws
line segments on the graph screen.
To Do This Press Display
(TI
.
83 Plus shown)
1. Exit the Topics in Algebra 1
application and clear the Home
screen.
y
l
á
EXIT
â
:
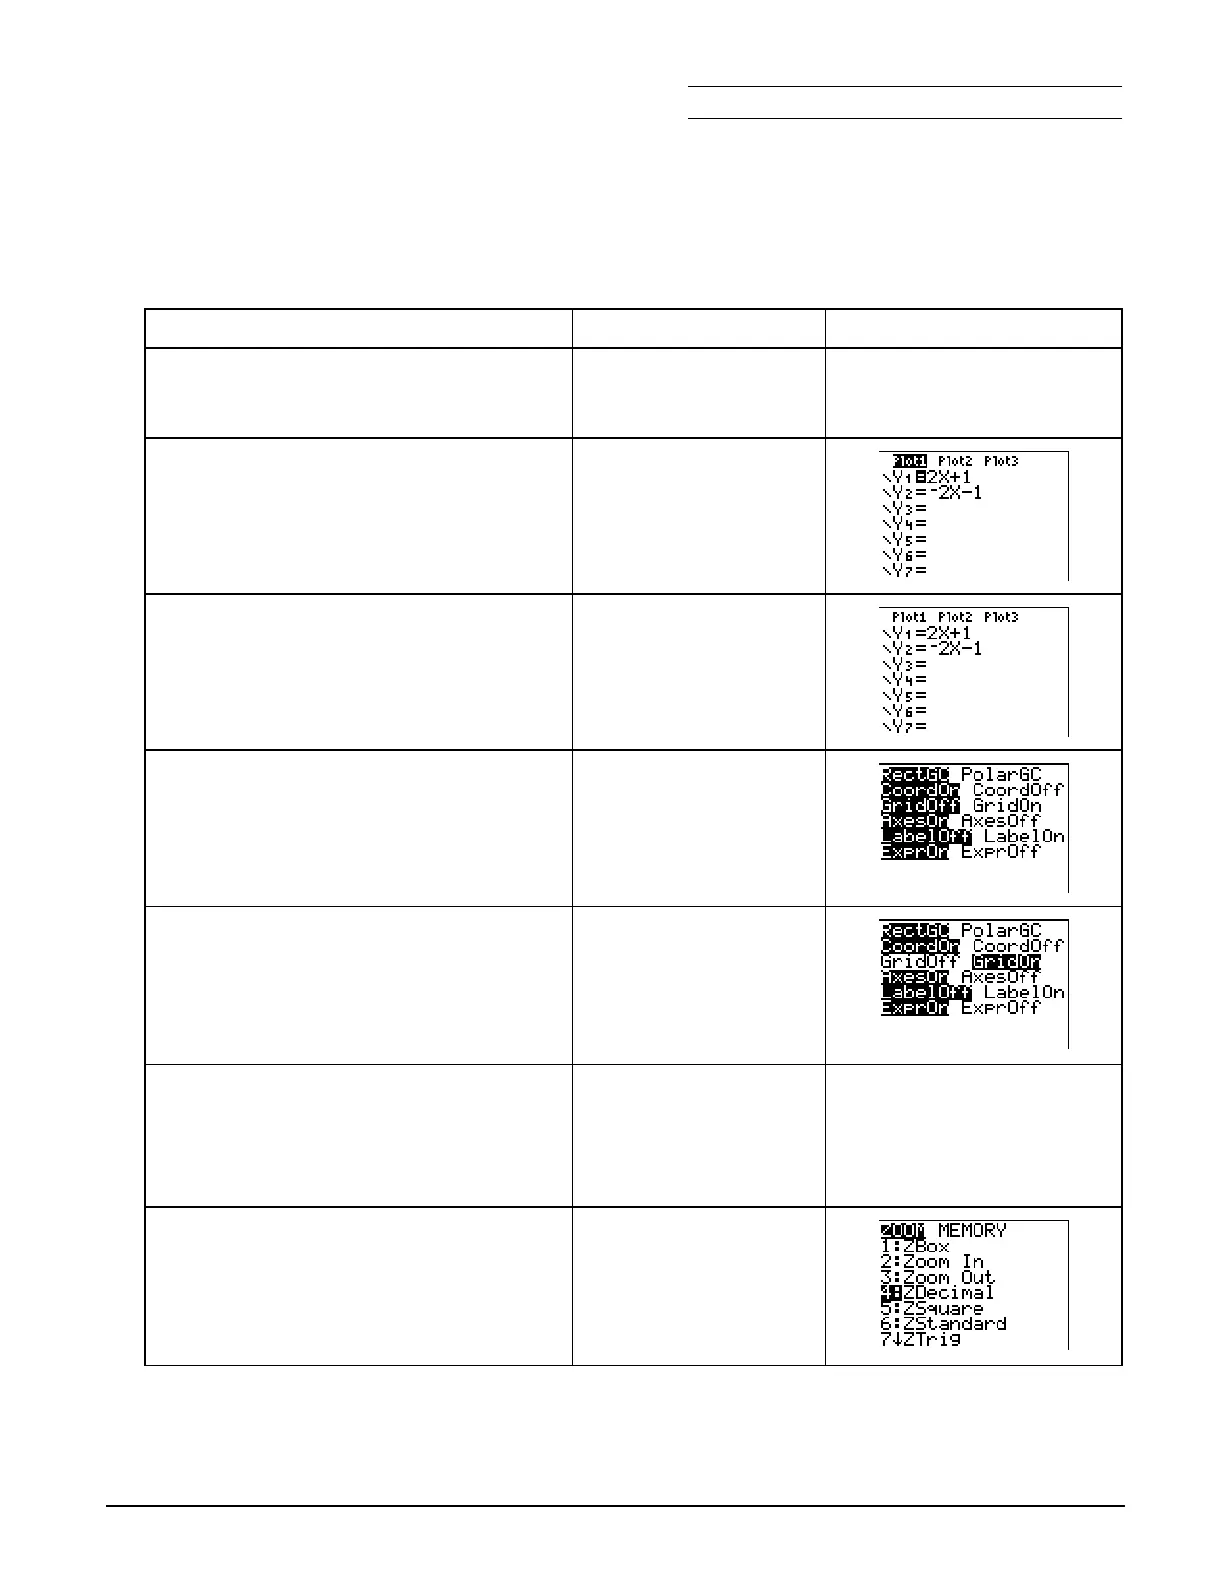
2. Check to see if any functions or
statistical plots are turned on.
o
3. Turn off statistical plots or functions,
if necessary.
Note:
See
³
TIp
é
8:
Creating a Statistical Plot
for
more information.
!
,
"
,
#
, or
$
b
to deselect
4. Display the window format screen.
-
g
5. Select
GridOn
.
TI
-
83 Plus:
#
#
"
b
TI
-
73:
#
"
b
6. Display the
ZOOM
menu. These
settings set the viewing window
automatically.
Note:
For more information, see
³
TIp 5:
Adjusting
the Viewing Window
.
(
7. Select
ZDecimal
.
Note
: This also displays the graph screen
automatically.
TI
-
83 Plus:
4:ZDecimal
TI
-
73:
8:ZDecimal
 Loading...


