Chapter 3: Linear Functions Name
Section 4: Slope-Intercept Form Date
Topics in Algebra 1 © 2001 Texas Instruments Student Worksheet 3-31
³
Try-It!
é
on Your TI
.
83 Plus or TI
.
73
Parent and Family of Functions
Compare graphs of
Y
1
=X
and
Y
2
=X+1
. If you know the graph of
Y
1
=X
, can you draw the graph of
any line in slope-intercept form? Investigate using your calculator!
Note
: See
³
TIp
é
3:
Graphing a Function
and
³
TIp
é
5
:
Adjusting the Viewing Window
for instructions if you need help. Set up your
calculator so that
GridOn
on the window format (
y
.
) screen and
ZDecimal
on the zoom menu (
q
) are selected.
To Do This Press Display
(TI
.
83 Plus
shown
)
1. Exit the Topics in Algebra 1
application and clear the Home
screen.
y
l
á
EXIT
â
:
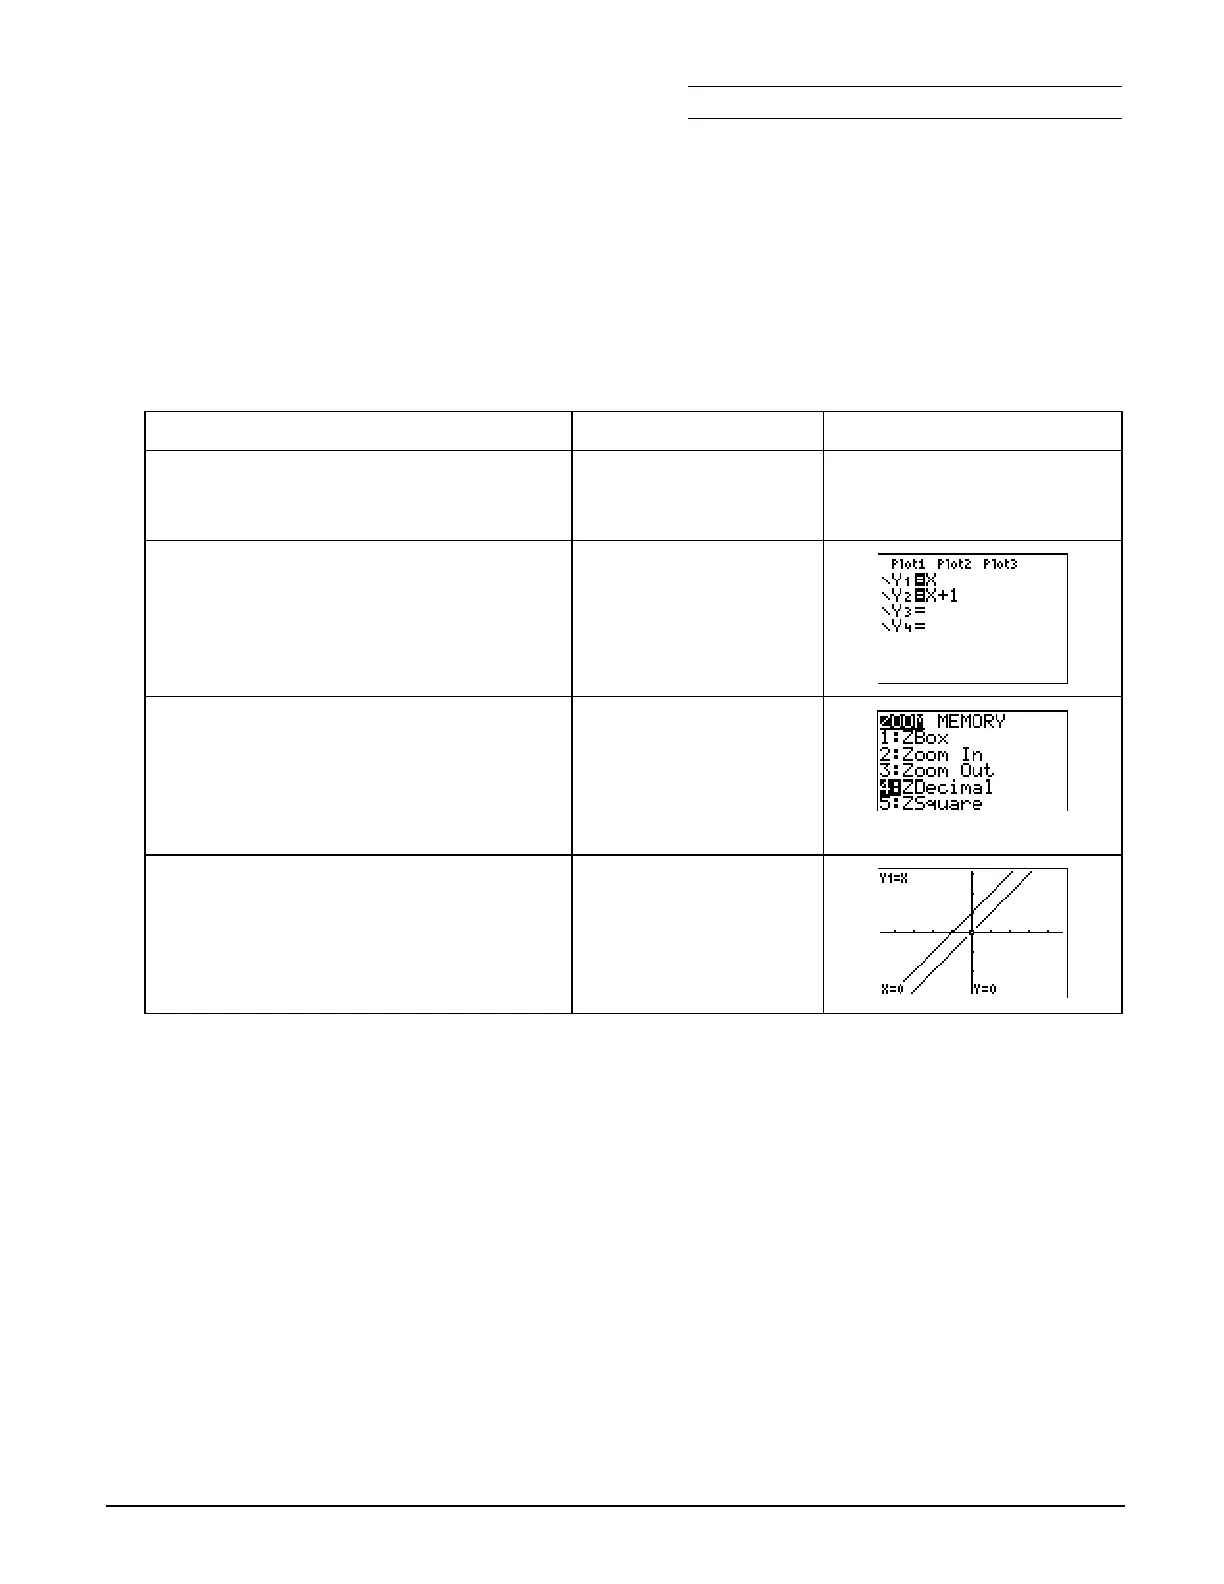
2. Define
Y
1
=X
and
Y
2
=X+1
.
Note
: On the TI
-
73, use
I
rather than
„
.
o
:
„
#
:
„
\
1
3. Set the viewing window.
TI
-
83 Plus:
(
4:ZDecimal
TI
-
73:
(
8:ZDecimal
4. Trace both
Y
1
and
Y
2
.
r
|
or
~
to trace a
function
}
and
†
to move
between functions
5. Write a description of what you see. How does the graph of
Y=X
compare to the graph of
Y=X+1
?
________________________________________________________________________________
________________________________________________________________________________

 Loading...


