© 2012 Thorlabs14
TSP01
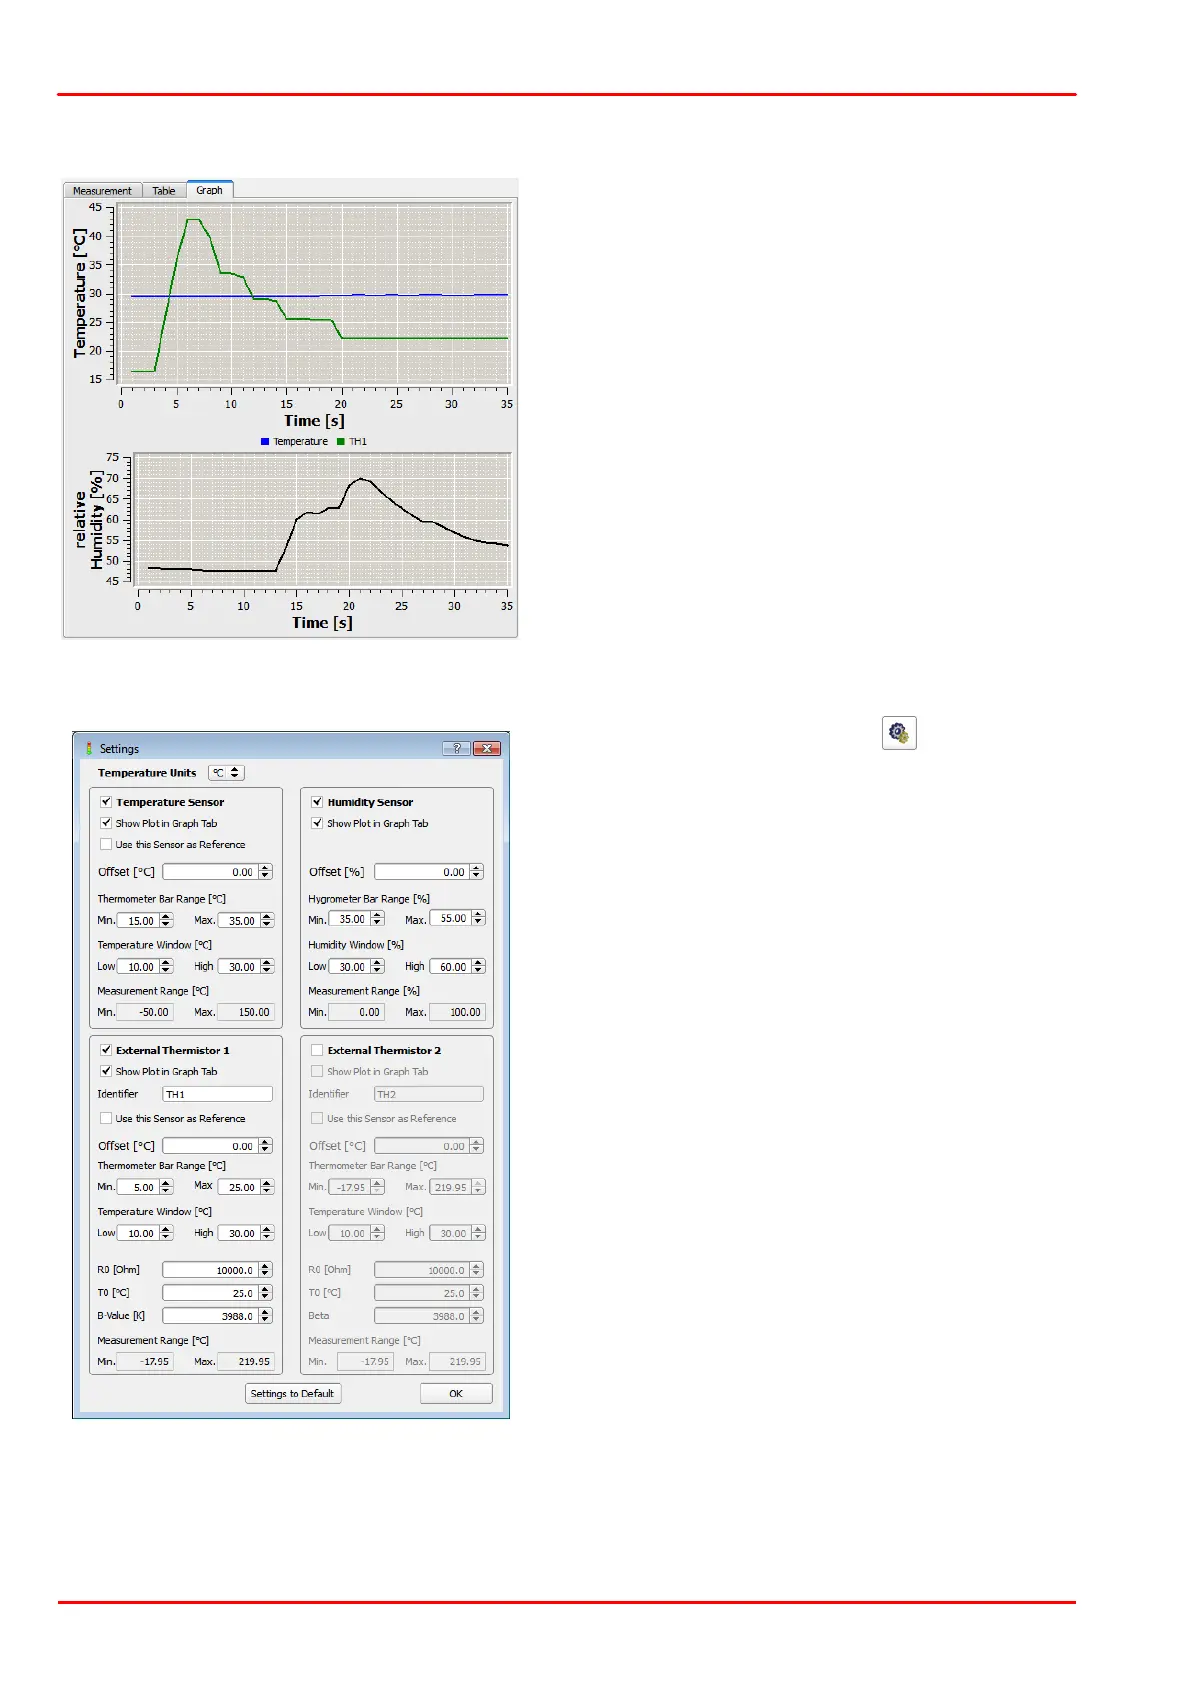
Tab Graph
In the Graph all logged data vs. time are
displayed, if enabled (Show Plot in Settings
menu)
Temperature: up to 3 curves can be displayed:
blue for internal sensor, green for external sensor
TH1 and red for external sensor TH2.
Rel. Humidity: If enabled (Show Plot in Settings
menu) it will show in black color the rel. humidity
value vs. time.
Settings panel
To adjust settings, click to the
icon or select
"Settings" from the "Option" menu.
From this panel you can adjust the appearance of
the GUI, change thermistor settings and enable/
disable sensor. Tool tips appear when moving the
mouse pointer over the appropriate parameter.
Detailed explanations can be found in the PDF
manual and in the online help.
Detailed operating instructions please see in the electronic versions of the manual that have
been installed to your computer along with the software and drivers.
 Loading...