6
1
2
5
6
7
3
4
2.4 READINGS SCREEN
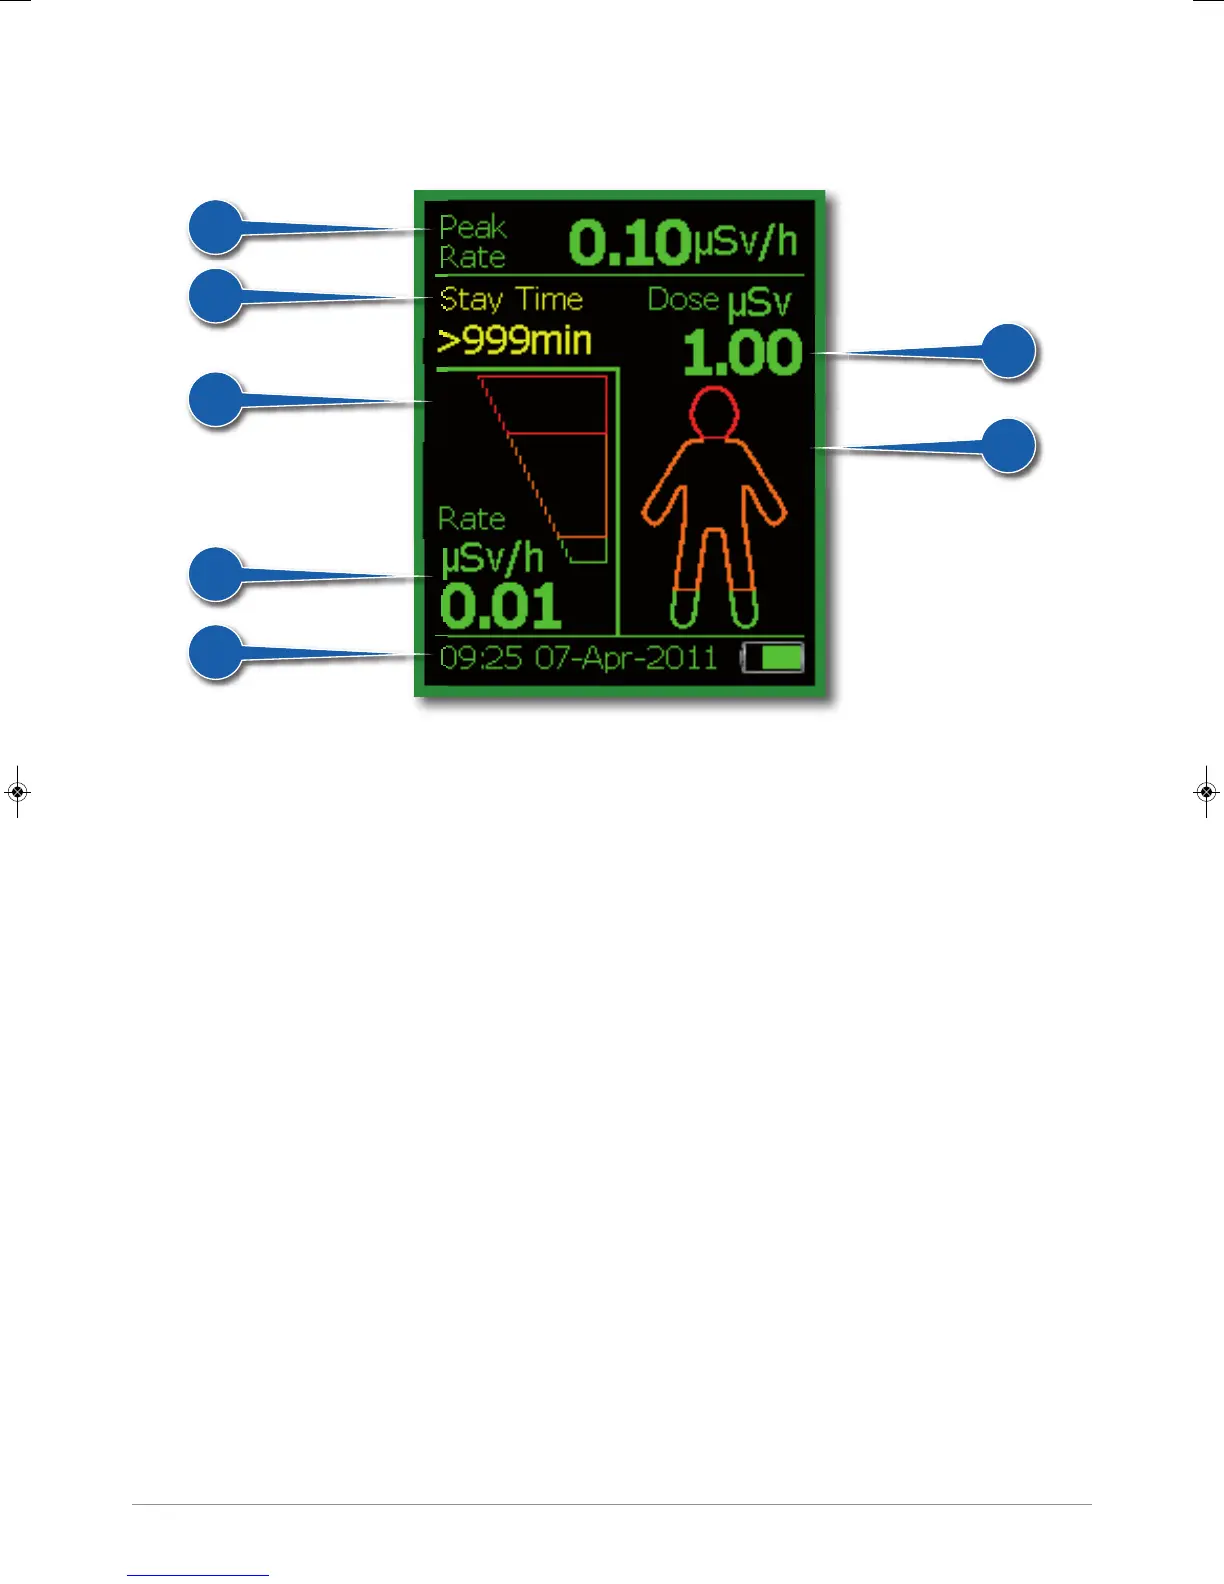
The readings screen is the main data display screen.
(1) Peak reading
This is the highest rate of dose detected since the last time the readings were transferred
onto DoseVision. Displayed in either µSv/h or mRem/h. See section 3.6.4 for units selection.
This section of the screen changes to a task dose display whilst tasks are running.
(2) Stay time
This is an estimate of the time you have left at current dose rate, until you reach the red dose alarm.
It is displayed in minutes with a range of 0 to 999 minutes.
(3) Dose
This is the total dose of radiation a person has received since the last readings were added
onto DoseVision. Displayed in either µSv or mRem. See section 3.6.4 for units selection.
(4) Dose Man display
Graphical display of accumulated dose level. The Dose Man will fill from the bottom as dose
is accumulated. Orange and red dose alarm thresholds are displayed on the Dose Man.
See section 3.6.1 for alarm threshold selection.
(5) Dose rate bar graph
Graphical display of current dose rate (linear scale). Orange and red dose rate alarm
thresholds are displayed on the bar graph. See section 3.6.1 for alarm threshold selection.
(6) Rate
Current dose rate. Displayed in either µSv/h or mRem/h. See section 3.6.4 for units selection.
(7) Status bar
Displays time, date and battery capacity. This display alternates with instrument status notices
if any are current.
38472_CD Manual 23/08/2013 14:25 Page 6


 To Next Page