UTD1000 User Manual
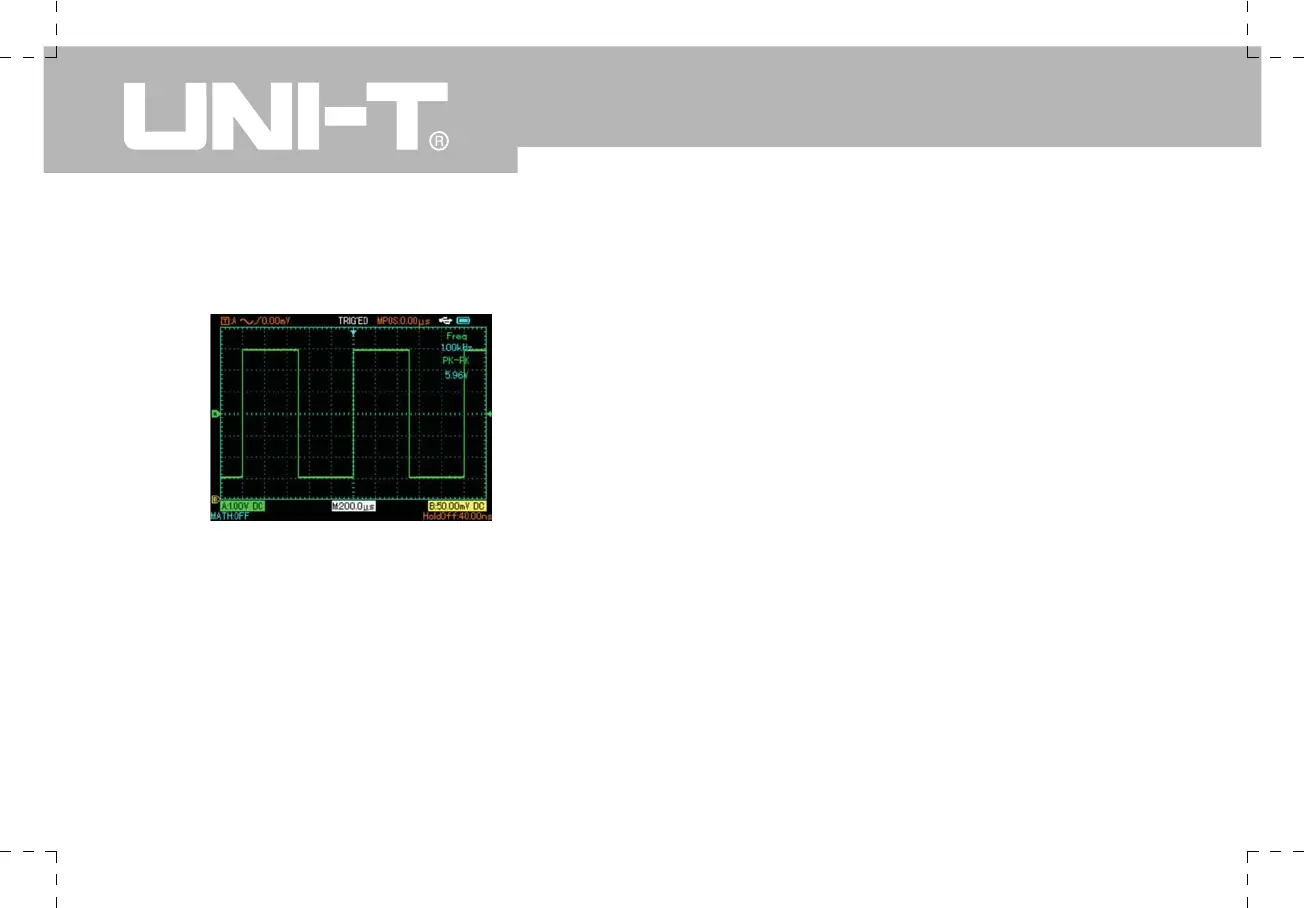
Frequency and Peak-to-peak measurements will now
appear in the top left corner of the screen.
Figure 3-1 Automatic measurement
Illustration 2 : Observing the delay caused
by a sine wave signal passes through the
circuit
As in the previous scenario, set the probe attenuation
factor of the probe and Oscilloscope channel to 10X.
Connect Channel A to the circuit signal input terminal.
Connect Channel B to the output terminal.
Steps :
1. To display Channel A and Channel B signals :
ķ
Press [AUTO].
ĸ
Continue to adjust the horizontal and vertical range
until you get the desired waveform display.
Ĺ
Press the Channel A vertical displacement key to
adjust Channel A’s vertical position.
ĺ
Press the Channel B vertical displacement key
to adjust Channel B’s vertical position so that the
waveforms of Channel A and B do not overlap. This will
make observation easier.
2.Observing the delay caused by a sine wave signal
passes through the circuit and observing waveform
changes.