With ultrasonic and radar sensors, the "False echo curve"
represents the saved false echoes (see menu "Service") of the
empty vessel with signal strength in "dB" over the measuring
range.
With all plics
®
sensors, up to 3000 measured values
(depending on the sensor) are recorded when starting a
"Trend curve". Then the values can be displayed over a
timeline. The oldest measured values are always deleted.
In the menu item "Choose curve", the respective curve is
selected.
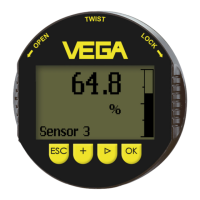
Curve selection
Echo curve
▼
Information:
The trend recording is not activated when being shipped. It
must be started by the user via the menu item "Start trend
curve".
A comparison of echo and false echo curve allows a more
detailled specification on the measurement reliability. The
selected curve is updated permanently. With the [OK] key, a
submenu with zoom functions is opened.
The following functions are available with "Echo and false
echo curve":
l "X-Zoom": Zoom function for the meas. distance
l "Y-Zoom": 1, 2, 5 and 10-times signal magnification in "dB"
l "Unzoom": Reset the presentation to the nominal measur-
ing range with single magnification
In the menu item "Trend curve" the following are available:
l "X-Zoom": Resolution
- 1 minute
- 1 hour
- 1 day
l "Stop/Start": Interrupt a recording or start a new recording
l "Unzoom": Reset the resolution to minutes
As default setting, the recording pattern has 1 minute. With the
adjustment software PACTware™, this pattern can be also set
to 1 hour or 1 day.
Curve presentation
16 Indicating and adjustment module PLICSCOM
Setup
27835-EN-070123