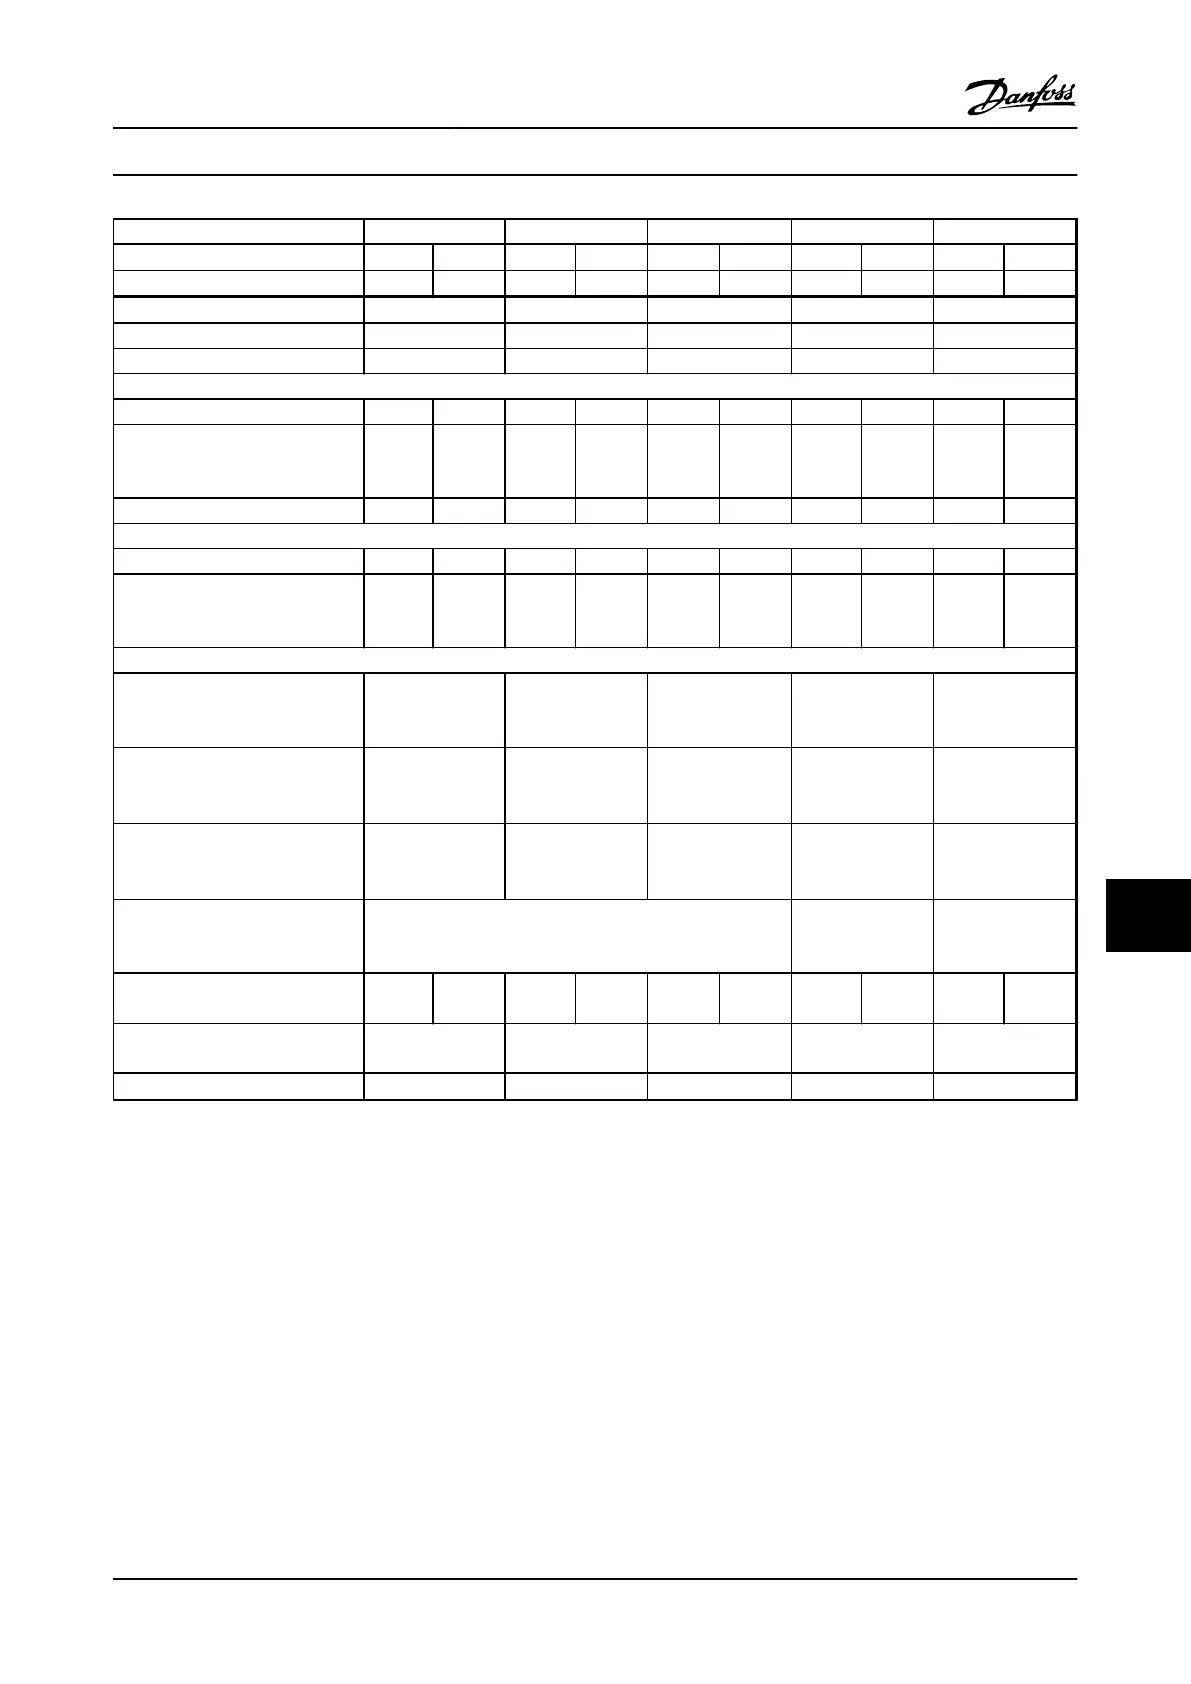
P15K P18K P22K P30K P37K
High/Normal Load
1)
HO NO HO NO HO NO HO NO HO NO
Typical Shaft Output (hp [kW]) 20 [15] 25 [18.5] 25 [18.5] 30 [22] 30 [22] 40 [30] 40 [30] 50 [37] 50 [37] 60 [45]
Enclosure IP20 B4 C3 C3 C4 C4
Enclosure IP21 C1 C1 C1 C2 C2
Enclosure IP55, IP66 C1 C1 C1 C2 C2
Output current
Continuous (3x200–240 V) [A] 59.4 74.8 74.8 88 88 115 115 143 143 170
Intermittent
(60 s overload)
(3x200–240 V) [A]
89.1 82.3 112 96.8 132 127 173 157 215 187
Continuous kVA (208 V AC) [kVA] 21.4 26.9 26.9 31.7 31.7 41.4 41.4 51.5 51.5 61.2
Max. input current
Continuous (3x200–240 V) [A] 54 68 68 80 80 104 104 130 130 154
Intermittent
(60 s overload)
(3x200–240 V) [A]
81 74.8 102 88 120 114 156 143 195 169
Additional specifications
IP20 max. cable cross-section
5)
(line power, brake, motor and load
sharing)
35 (2) 50 (1) 50 (1) 300MCM (150) 300MCM (150)
IP21, IP55, IP66 max. cable cross-
section
5)
(line power, motor) [mm
2
(AWG)]
2)
50 (1) 50 (1) 50 (1) 300MCM (150) 300MCM (150)
IP21, IP55, IP66 max. cable cross-
section
5)
(brake, load sharing)
[mm
2
(AWG)]
2)
50 (1) 50 (1) 50 (1) 95 (3/0) 95 (3/0)
Max. cable size with line power
disconnect [AWG (mm
2
)]
2)
50, 35, 35 (1, 2, 2)
95, 70, 70
(3/0, 2/0, 2/0)
185, 150, 120
(350MCM,
300MCM, 4/0)
Estimated power loss
at rated max. load [W]
4)
624 737 740 845 874 1140 1143 1353 1400 1636
Weight, enclosure IP21, IP55/IP66
(lbs [kg])
99.21 [45] 99.21 [45] 99.21 [45] 143.3 [65] 143.3 [65]
Efficiency
4)
0.96 0.97 0.97 0.97 0.97
Table 10.3 Line Power Supply 3x200–240 V AC
For fuse ratings, see 10.3.1 Fuses
1) High overload = 160% torque during 60 s. Normal overload = 110% torque during 60 s.
2) American Wire Gauge.
3) Measured using 16.5 ft. [5 m] shielded motor cables at rated load and rated frequency.
4) The typical power loss is at nominal load conditions and expected to be within
±
15% (tolerance relates to variances in voltage and
cable conditions).
Values are based on a typical motor efficiency (eff2/eff3 border line). Motors with lower efficiency will also add to the power loss in the
adjustable frequency drive and vice-versa.
If the switching frequency is increased compared to the default setting, the power losses may rise significantly.
LCP and typical control card power consumption values are included. Further options and customer load may add up to 30 W to the
losses. (Though typical only 4 W extra for a fully loaded control card, or options for slot A or slot B, each).
Although measurements are made with state of the art equipment, some measurement inaccuracy must be allowed for (
±
5%).
Specifications
VLT
®
AutomationDrive Instruction
Manual
MG33AM22 - VLT
®
is a registered Danfoss trademark 10-3
10
10