Page 52JBE(X) Manual
Section G - Maintenance
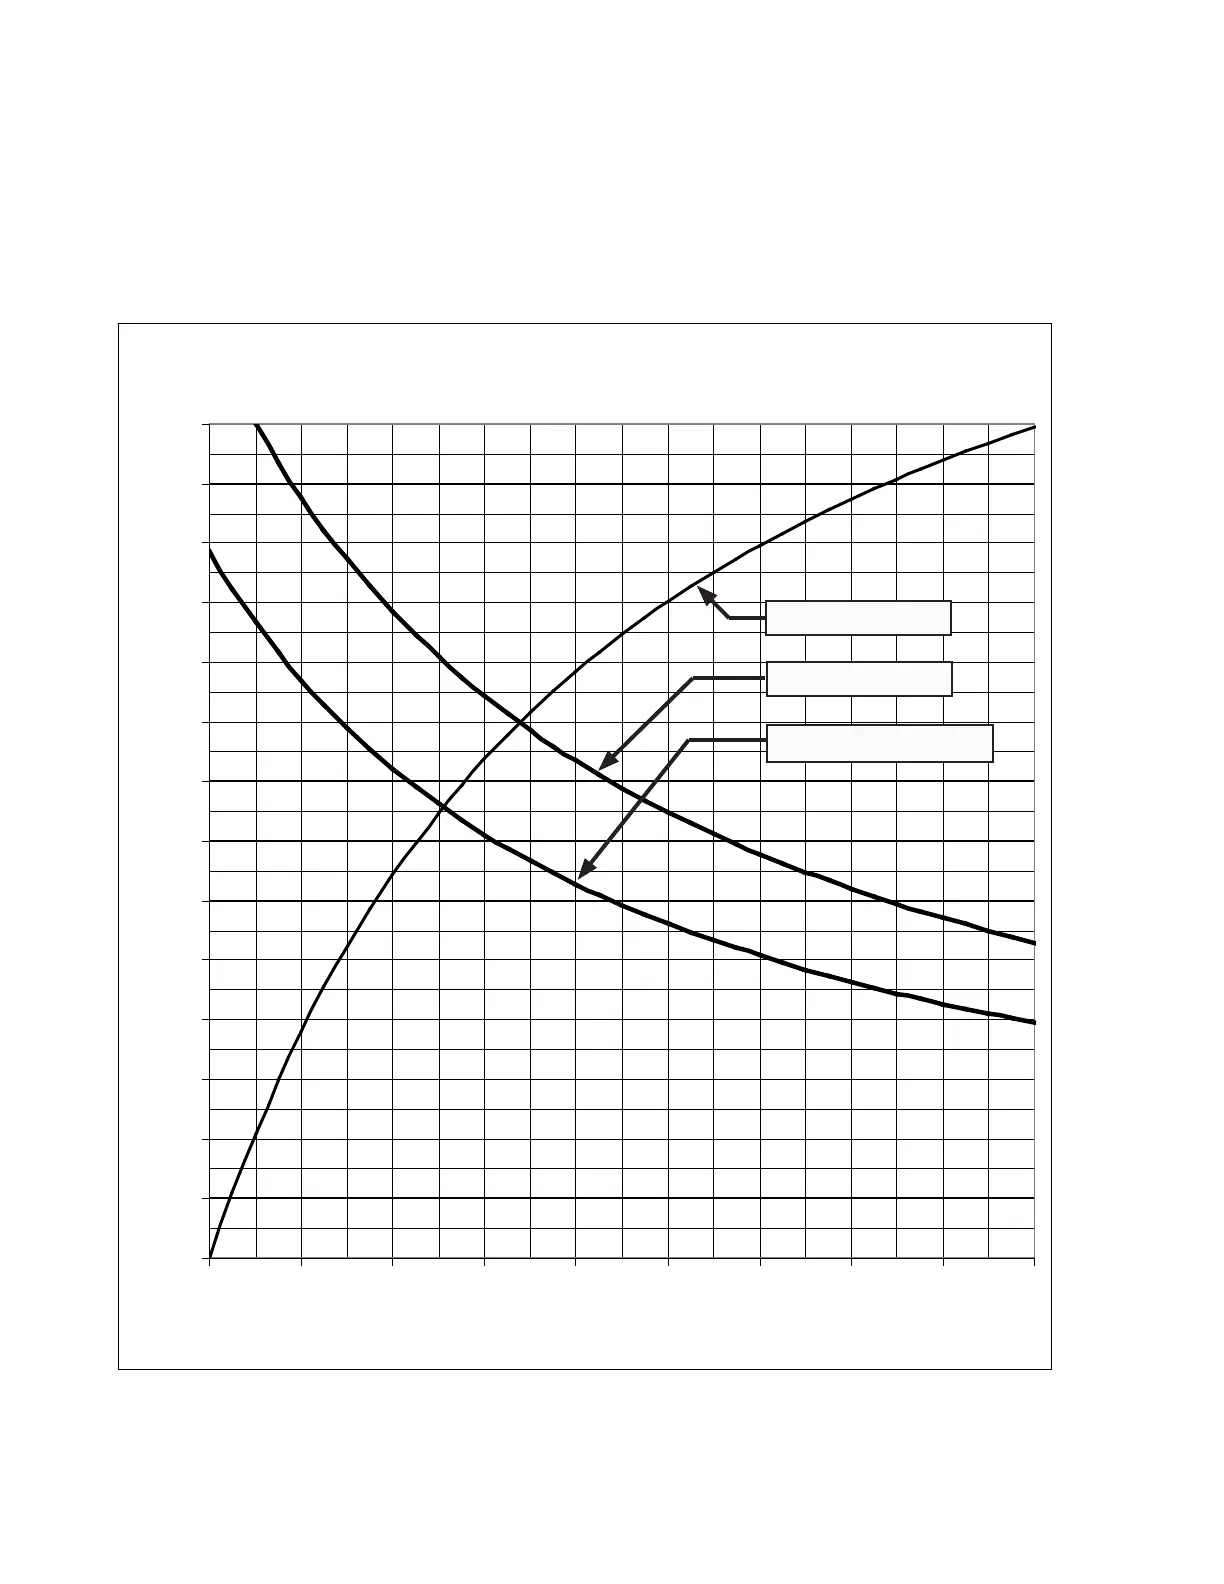
9 - Combustion Chart
This graph shows the relationship between excess air, %Oxygen and %CO2, which is typically obtained
from a ue gas analyzer. The values are based on a dry reading, where the ue gas is extracted and cooled
before the analysis if done.
0
1
2
3
4
5
6
7
8
9
10
11
12
13
14
0 20 40 60 80 100 120 140 160 180
Excess Air vs. % Oxygen and % CO2
% Excess Air
% Oxygen and % CO2 (dry)
% Oxygen
% CO2 (#2 oil)
% CO2 (gas)