10
music system in a normal room, adjustment over full octave intervals is satisfactory.
Ways to measure and adjust the average response for each octave interval follow.
The most commonly used procedure of measurement and adjustment is to connect a pink
noise generator to an appropriate input into the preamplifier. The system then generates
acoustic noise in the room that excites all octaves with equal power. Analysis of the room
sound is then made with a standard microphone and a real time analyzer. To carry this
out, first connect the pink noise generator to one channel only of the stereo system. Make
certain that your preamplifier's or receiver's tone controls and loudness control are in the
FLAT position. START OUT AT A VERY LOW LEVEL AND ADJUST THE GAIN
CONTROLS CAREFULLY TO A CONVENIENT MEASURING LEVEL. MAKE
CERTAIN THAT ALL HIGH FREQUENCY BOOST CONTROLS IN THE MODEL
4100 ARE IN THE FLAT POSITION. HIGH FREQUENCY DRIVERS CAN BE
BURNED OUT BY ENERGY THAT THE EAR DOES NOT HEAR.
Next, a standard microphone compatible with the analyzer is placed in the center of the
listening area. With this pickup feeding the real time analyzer you are ready to begin
some adjustment of the individual controls. First, you must consider what type of house
curve (i.e., the room response) you prefer. Under some circumstances you might want all
octaves to have equal response, or a flat house curve. This is not necessarily the best
choice. Since high frequency sound is absorbed preferentially in most rooms, the natural
condition to which we are accustomed is a gradual roll-off above 2 kHz. If the sound
system is forced to make the room response appear flat, you will probably not be satisfied
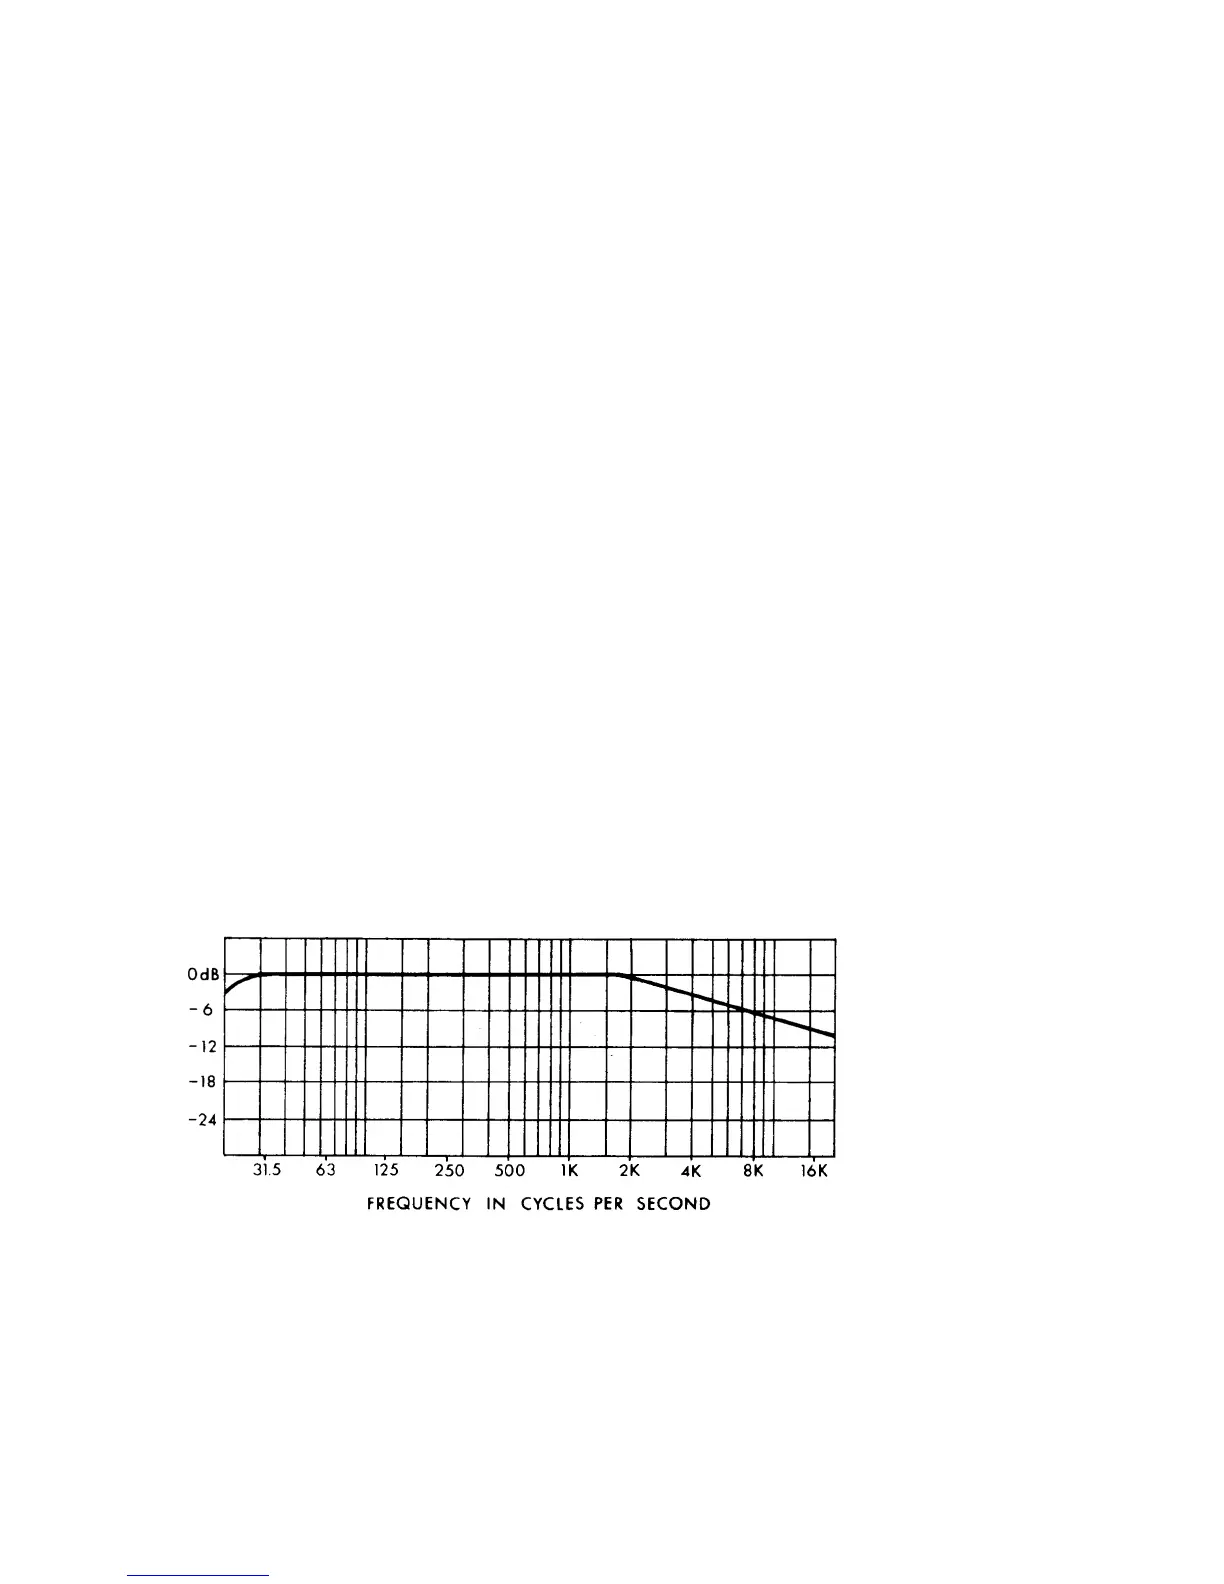
with the excess high frequency acoustic level that results. The response curve to which
you try to make the system conform will probably fall off at a rate of about 3 dB in each
octave above 2 kHz (see Figure 4). In the end, listening will determine the choice. The
owner must satisfy his own ear in making the choice of what to do with the high
frequency end of the spectrum. He should not hesitate to make the measurements drop off
smoothly above 2 kHz at whatever rate he finds pleasing.
When the real time analyzer has indications in one-third octave intervals, some averaging
of the three readings that make up an octave must be made. It will probably be acceptable
to average the readings in dB's since all three should be nearly the same. If there are large
variations from one channel to the next in the one-third octave analysis, there evidently
are some room resonances that will cause trouble later on and, if possible, some
experiments in speaker placement should be made. After taking an average reading for
Figure 4