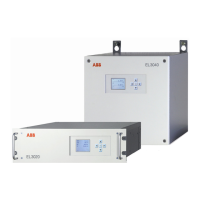
6 EasyLine EL3000 Series Data Sheet 10/24-4.10 EN Rev. 9
Ultraviolet photometer Limas23
Measurement principle
UV-RAS (UV Resonance Absorption Spectroscopy) method for
sample component NO,
NDUV (Interference filter correlation) method for sample
components NO
2
and SO
2
Photometer to measure up to 3 components
Sample components and measurement ranges
Sample components and measurement ranges
Sample component Smallest / Largest measurement range
NO 0–50 ppm / 0–5000 ppm
NO
2
0–50 ppm / 0–500 ppm
SO
2
0–100 ppm / 0–5 vol.-%
The NOx measurement value can be evaluated as the sum of
the NO and NO
2
measurement values and output at an analog
output. The NOx measurement range results from the sum of
the NO and NO
2
measurement ranges.
NO processed through a converter can be indicated as
sample component “NOx” on the display (factory-set).
For indication of the NOx measurement value in mg/m
3
, the
factor 1.53 is taken into account for conversion of NO to NOx
(factory-set).
Measurement range quantity
2 measurement ranges
Measurement range limits
Smallest measurement range Largest measurement range
0–50 ppm 0–250 ppm
0–100 ppm 0–500 ppm
0–200 ppm 0–1000 ppm
0–400 ppm 0–2000 ppm
0–1000 ppm 0–5000 ppm
0–4000 ppm 0–20000 ppm
0–1 vol.-% 0–5 vol.-%
An individual measurement range within the limits shown in
the table can be factory-set on special order.
Measurement ranges are freely adjustable within the limits
shown in the table.
Stability
The following data apply only if all influence factors (e.g. flow
rate, temperature, atmospheric pressure) are constant. They
relate to the smallest measurement range.
Linearity deviation
≤ 1 % of span
Repeatability
≤ 0.5 % of span
Zero drift
– For NO: ≤ 2 % of span per week
– For NO
2
and SO
2
: ≤ 3 ppm per week for measurement
ranges ≤ 100 ppm (daily automatic baseline check is
recommended), ≤ 2.5 % of span per week for measurement
ranges > 100 ppm
Sensitivity drift
≤ 1 % of measured value per week
Output fluctuation (2 σ)
≤ 0.5 % of span at electronic T90 time = 20 sec
Detection limit (4 σ)
≤ 1 % of span at electronic T90 time = 20 sec
Influence effects
Flow effect
Flow rate in the 20–100 l/h range: within detection limits
Associated gas effect/cross sensitivity
The knowledge of the sample gas composition is necessary
for the analyzer configuration.
Selectivity measures to reduce associated gas effect
(optional): Internal adjustment or internal electronic cross-
sensitivity correction for one sample component by other
sample components measured with the gas analyzer.
Temperature effect
Ambient temperature in permissible range
– At zero-point: ≤ 1 % of span per 10 °C
– On sensitivity: ≤ 1.5 % of measured value per 10 °C
Air pressure effect
– At zero-point: No effect
– On sensitivity with pressure correction by means of integral
pressure sensor: ≤ 0.2 % of measured value per 1 %
barometric pressure change
The pressure sensor is located in the sample gas path.
Pressure sensor working range: p
abs
= 600–1250 hPa
Power supply effect
Voltage and frequency in the permissible range: No effect
 Loading...