35
[3] Viewing MEMORY Test Results
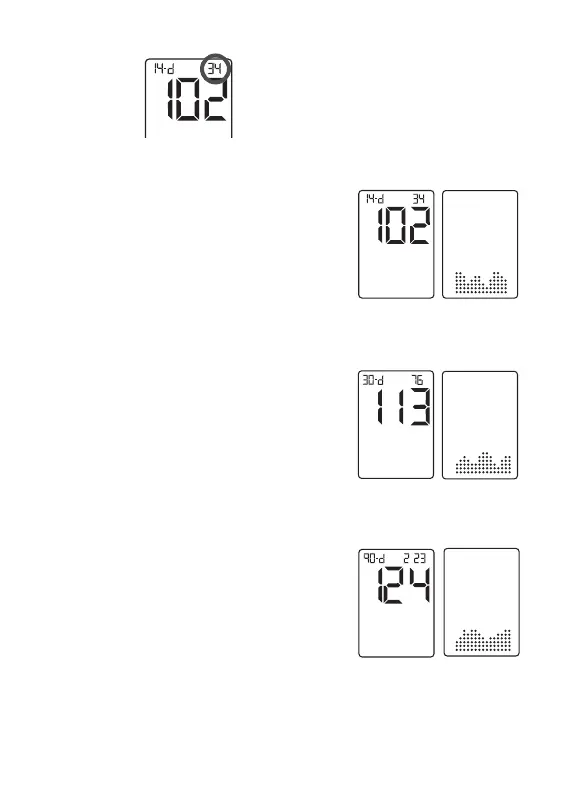
View 14 Day Averages and Graphs:
The display shows your 14 day
numerical average. Press the RIGHT or
LEFT arrow buttons to view your 14 day
trend graph.
You can move from the 14 day trend graph to the 14 day nu-
merical average by pressing the RIGHT or LEFT arrow buttons.
View 30 Day Averages and Graphs:
Press the CENTER button to view your
30 day numerical average. Press the
RIGHT or LEFT arrow buttons to view
your 30 day trend graph.
You can move from the 30 day trend graph to the 30 day nu-
merical average by pressing the RIGHT or LEFT arrow buttons.
View 90 Day Averages and Graphs:
Press the CENTER button to view your
90 day numerical average. Press the
RIGHT or LEFT arrow buttons to view
your 90 day trend graph.
You can move from the 90 day trend graph to the 90 day nu-
merical average by pressing the RIGHT or LEFT arrow buttons.
mg /dL
The number of glucose test results
saved (within the time period) is
displayed in the top right corner.
14
mg /dL
30
90
mg /dL
mg /dL