Page 23
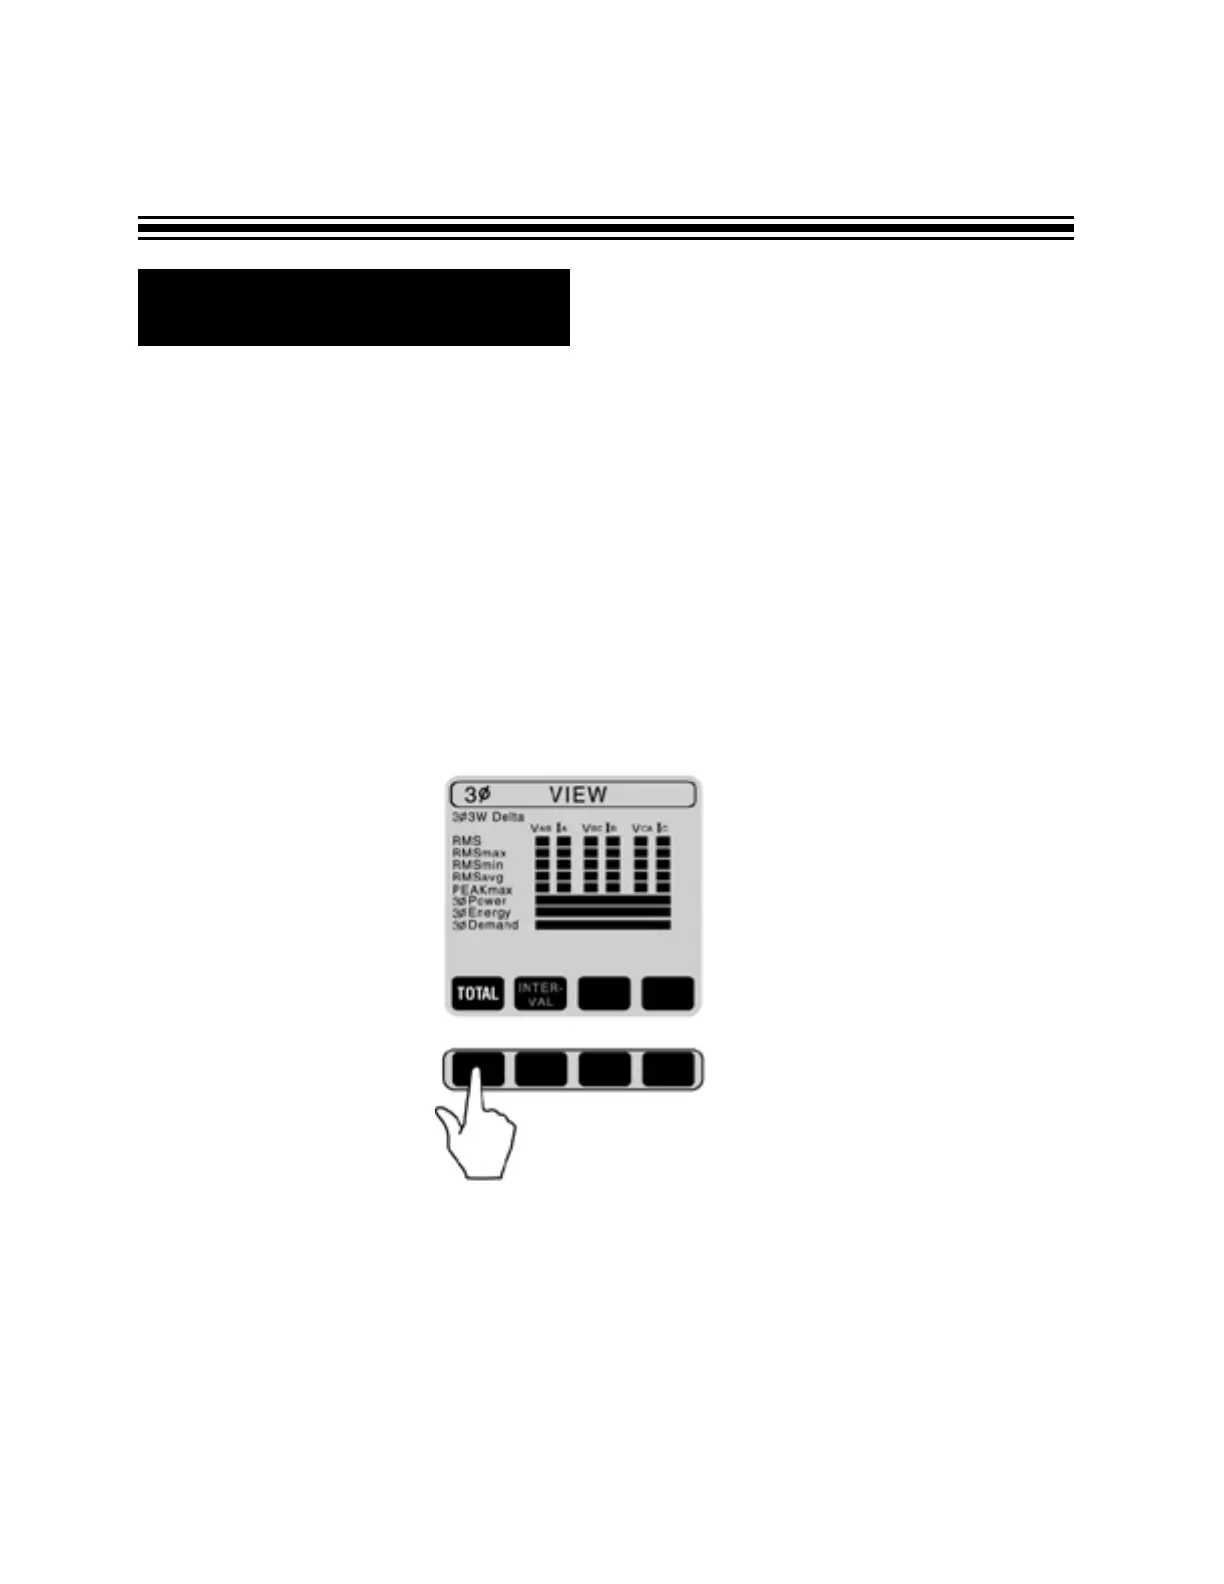
R Viewing Data (cont’d.)
ON DEMAND RECORDING (INTERVAL was set-up to either 15 or 20 minutes during recording).
To view desired parameter, move blinking cursor to the parameter.
- If you selected RMS, the chart on Page 21 will be shown.
- If you selected POWER, the parameters are going to be displayed the same way as on Page 22.
- If you selected events, max, min, ave, peak or energy - the total and interval selection is available
(explained in the next section).