When the Chart (Medium Resolution) is selected, the chart shows the variation of the selected input per
hour. The screen shows the last 4 hours.
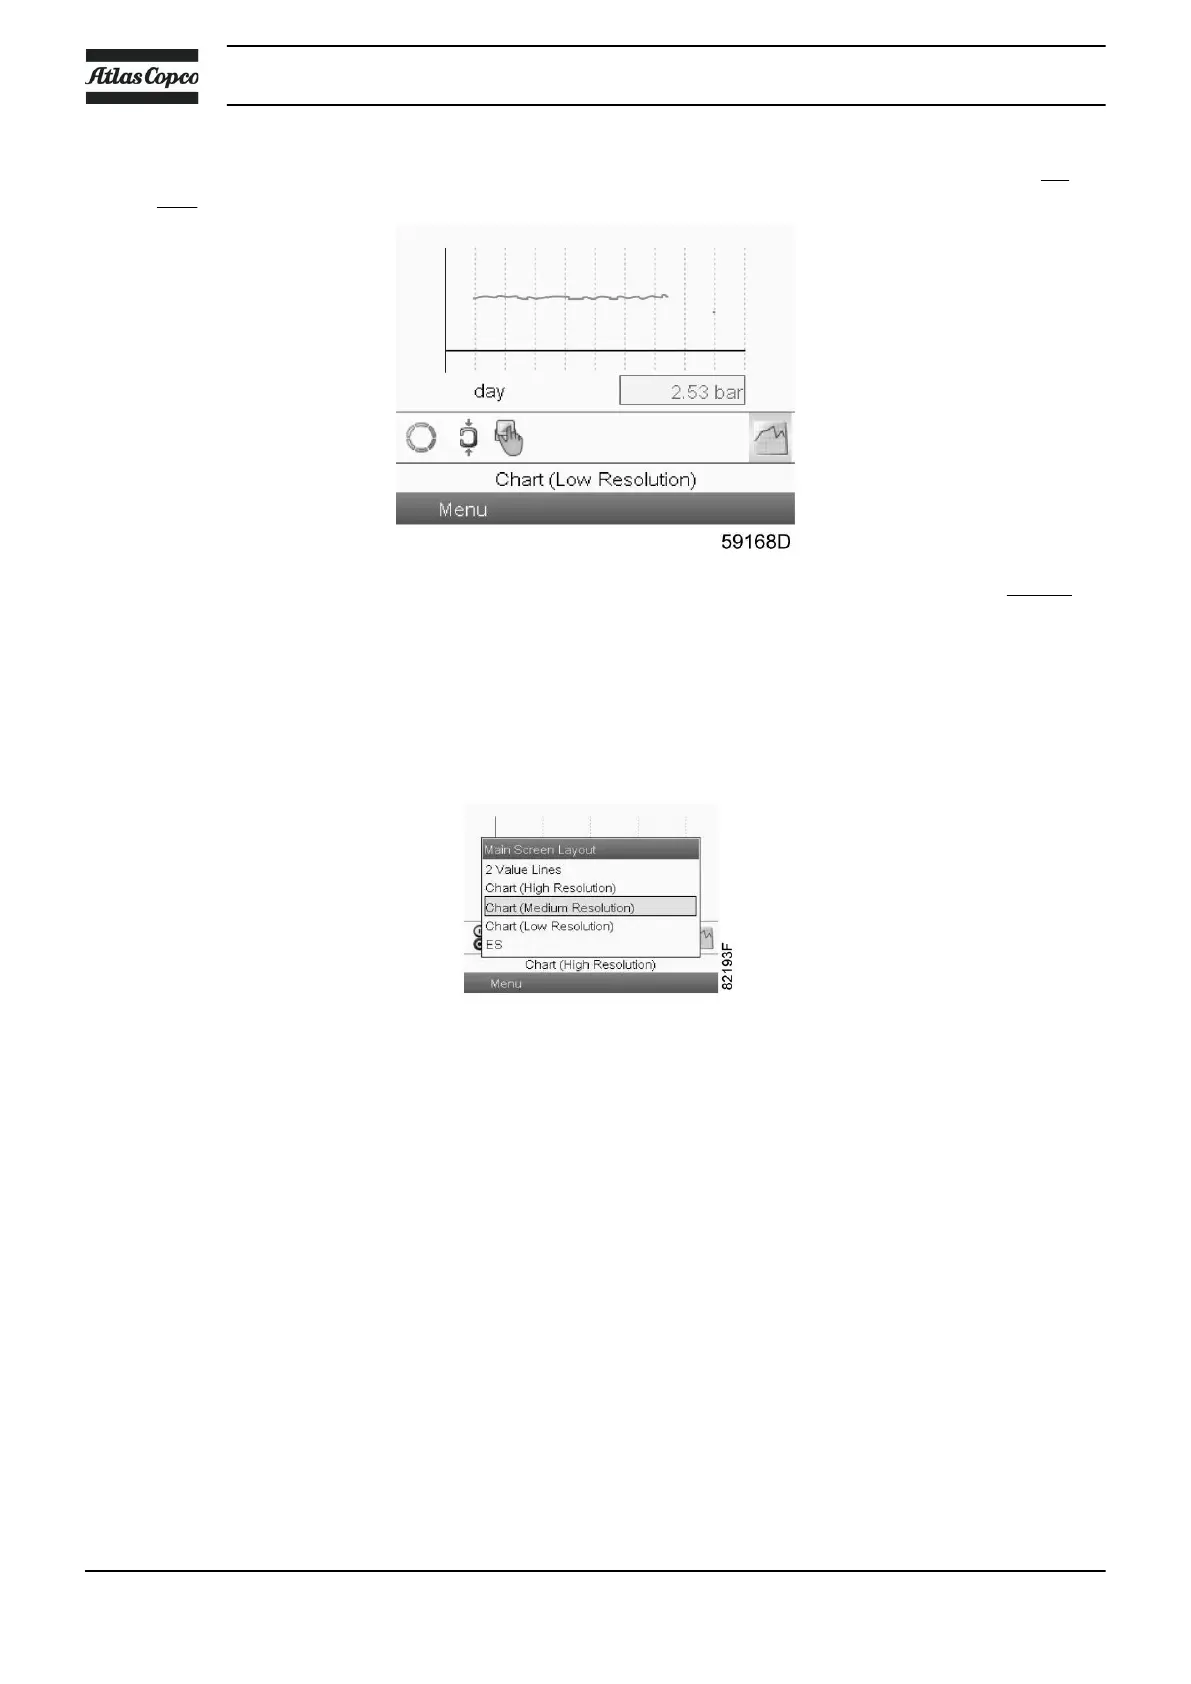
When the Chart (Low Resolution) is selected, the chart shows the variation of the selected input per day.
The screen shows the evolution over the last 10 days.
Selection of a main screen view
To change between the different screen layouts, select the far right icon in the control icons line (see value
lines display icon or chart display icon in section Icons used) and press the Enter key. A screen similar to
the one below opens:
Select the layout required and press the Enter key. See also section Inputs menu.
Instruction book
32 2920 7109 23
 Loading...