To activate an action button, highlight the button by using the Scroll keys and press the Enter key.
To go back to the previous menu, press the Escape key.
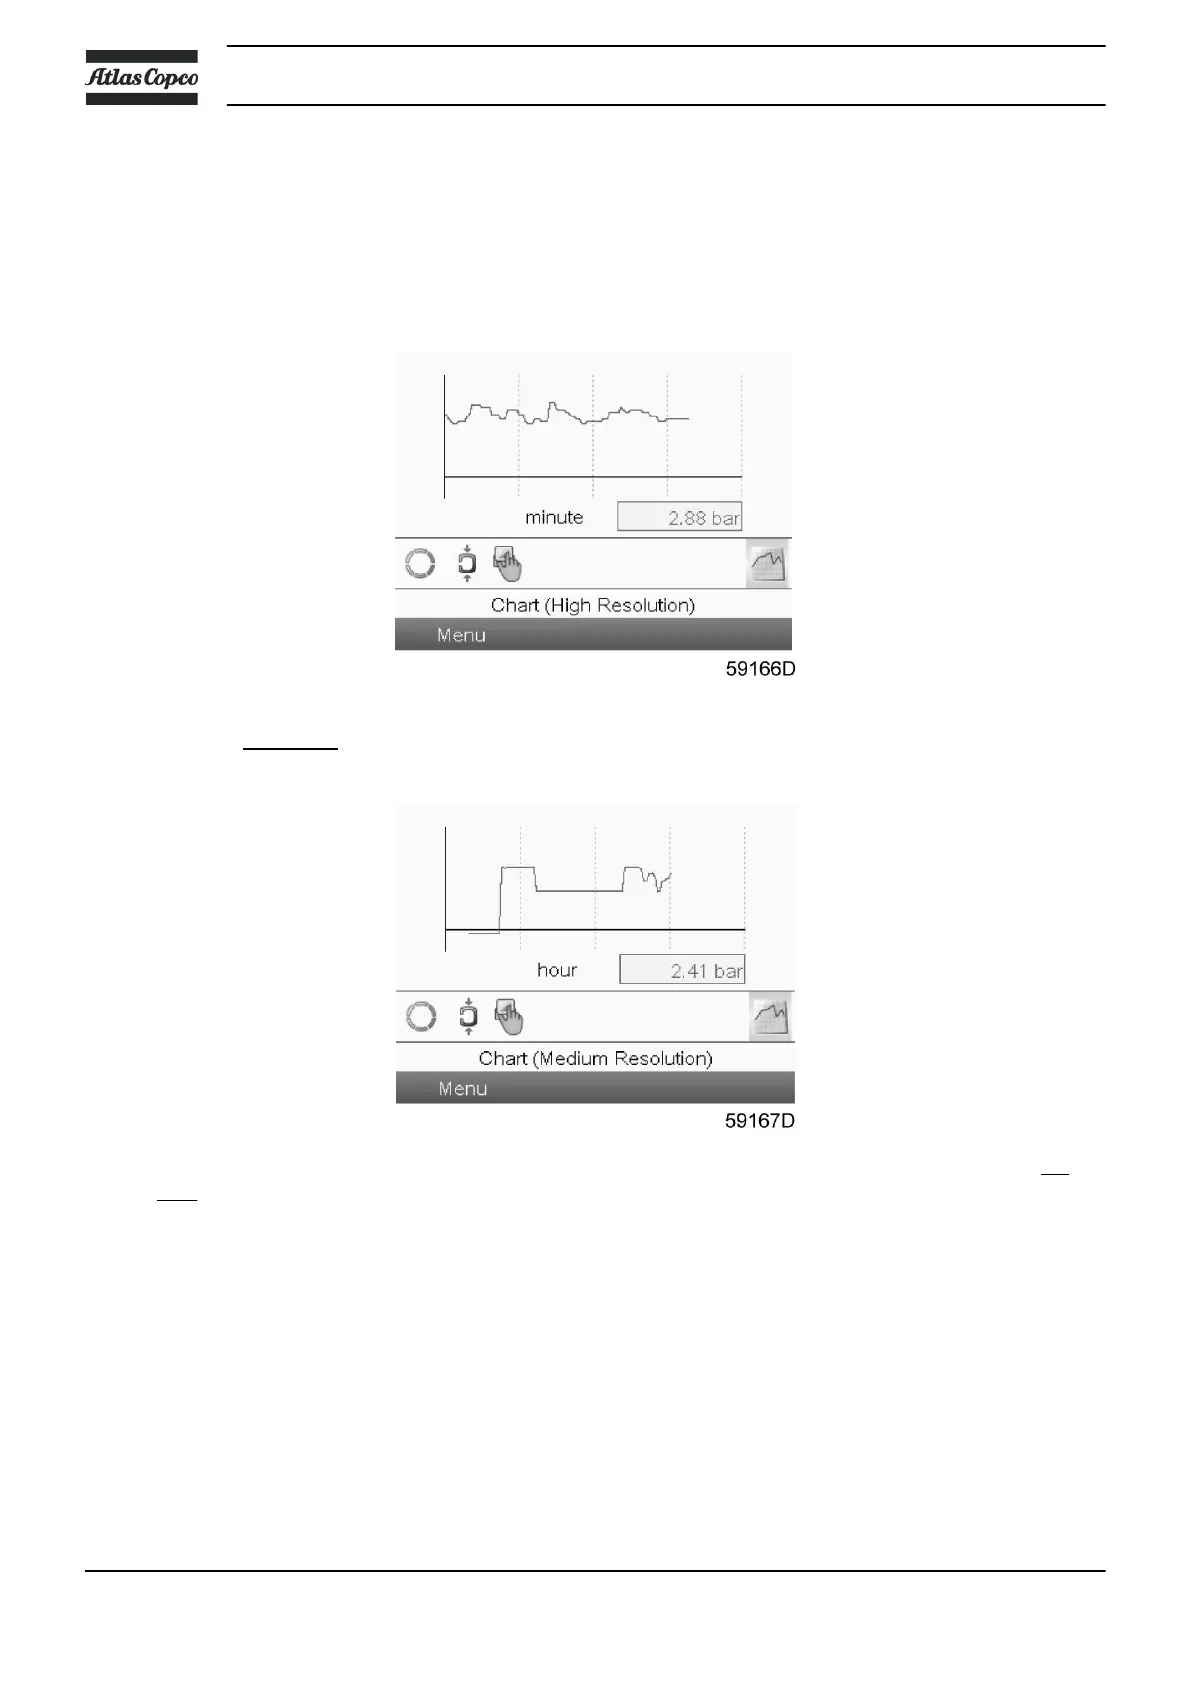
Chart views
Instead of viewing values, it is also possible to view a graph of one of the input signals (see section Inputs
menu) in function of the time.
When Chart (High Resolution) is selected, the chart shows the variation of the selected input (in this case the
pressure)
per minute. Also the instantaneous value is displayed. The screen shows the last 4 minutes.
The switch button (icon) for selecting other screens is changed into a small Chart and is highlighted (active).
When the Chart (Medium Resolution) is selected, the chart shows the variation of the selected input per
hour. The screen shows the last 4 hours.
Instruction book
28 2920 7104 10
 Loading...