30
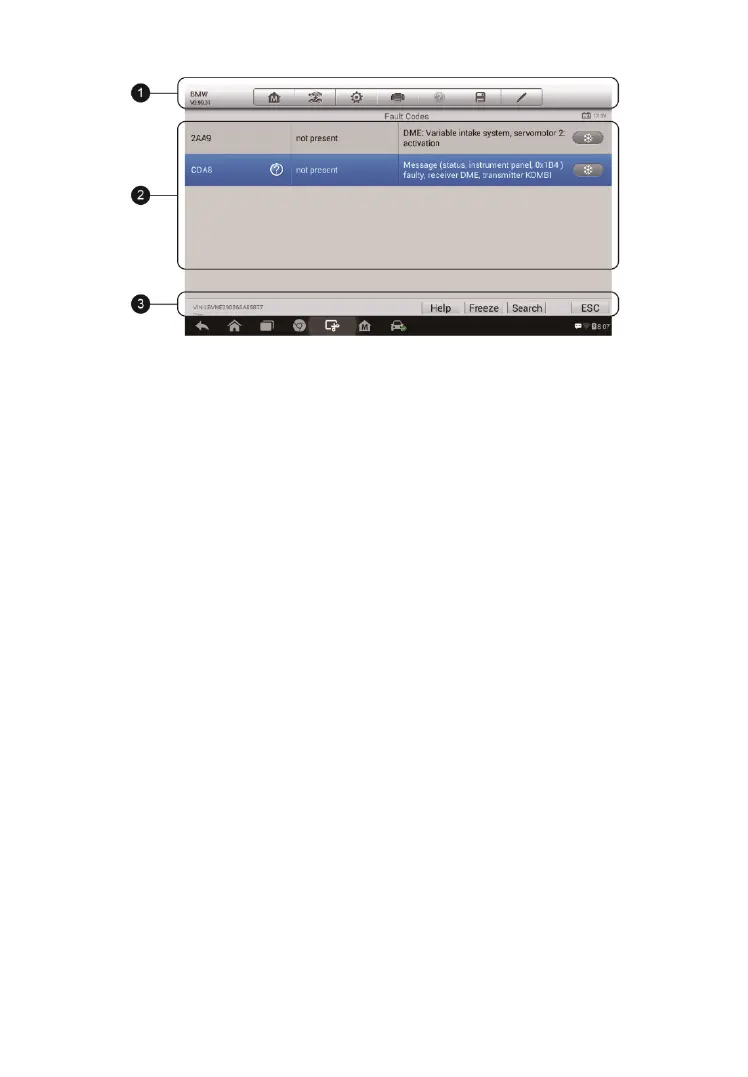
1. Diagnostics Toolbar Buttons – see Table 4-2 Diagnostics
Toolbar Buttons on page 21 for detailed descriptions of the operations
for each button.
2. Main Section
Code Column – displays the retrieved codes from the vehicle.
Status Column – indicates the status of the retrieved codes.
Description Column – detailed descriptions for the retrieved codes.
Snowflake Icon – only displays when freeze frame data is available
for viewing; selecting this icon will display a data screen that looks
very similar to the Read Codes screen.
3. Functional Button
Help – tap this to view the information of the fault code, including
fault description, condition for fault identification and driver
information.
Freeze – tap this to view the freeze frame.
Search – tap this icon to search fault-code related information in
Google.
ESC – tap it to return to the previous screen or exit the function.
Figure 4-12 Sample Read Codes Screen
 Loading...