Figure 55
The buttons on the lower area of Figure 55 allows to change the displayed time range (10
minutes, 1 hour, 1 day) and to go back and forward.
Click on the button to enable the multiple viewing then select up to a maximum of 10
zones in the left side list. Click on the button.
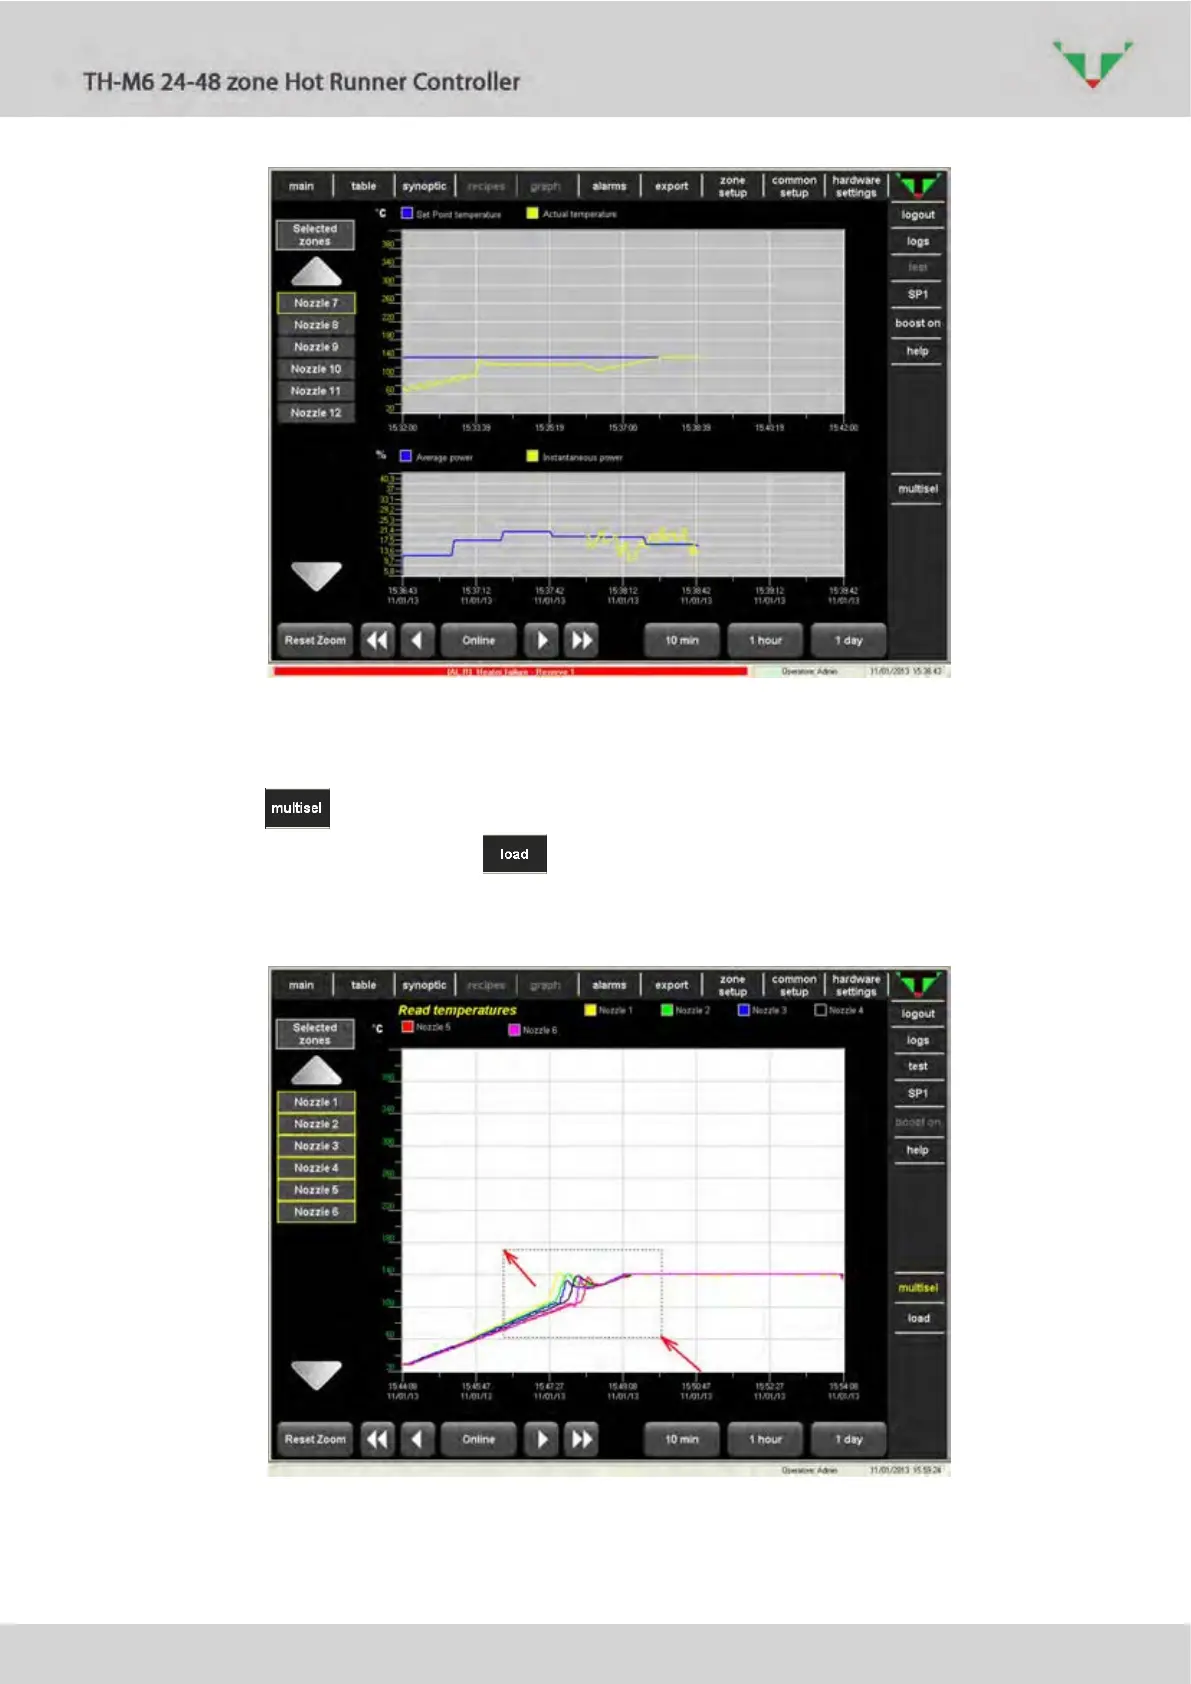
It’s possible to zoom an area of the graph simply dragging a window, e.g. between the two
points of Figure 56 (red arrows).
Figure 56