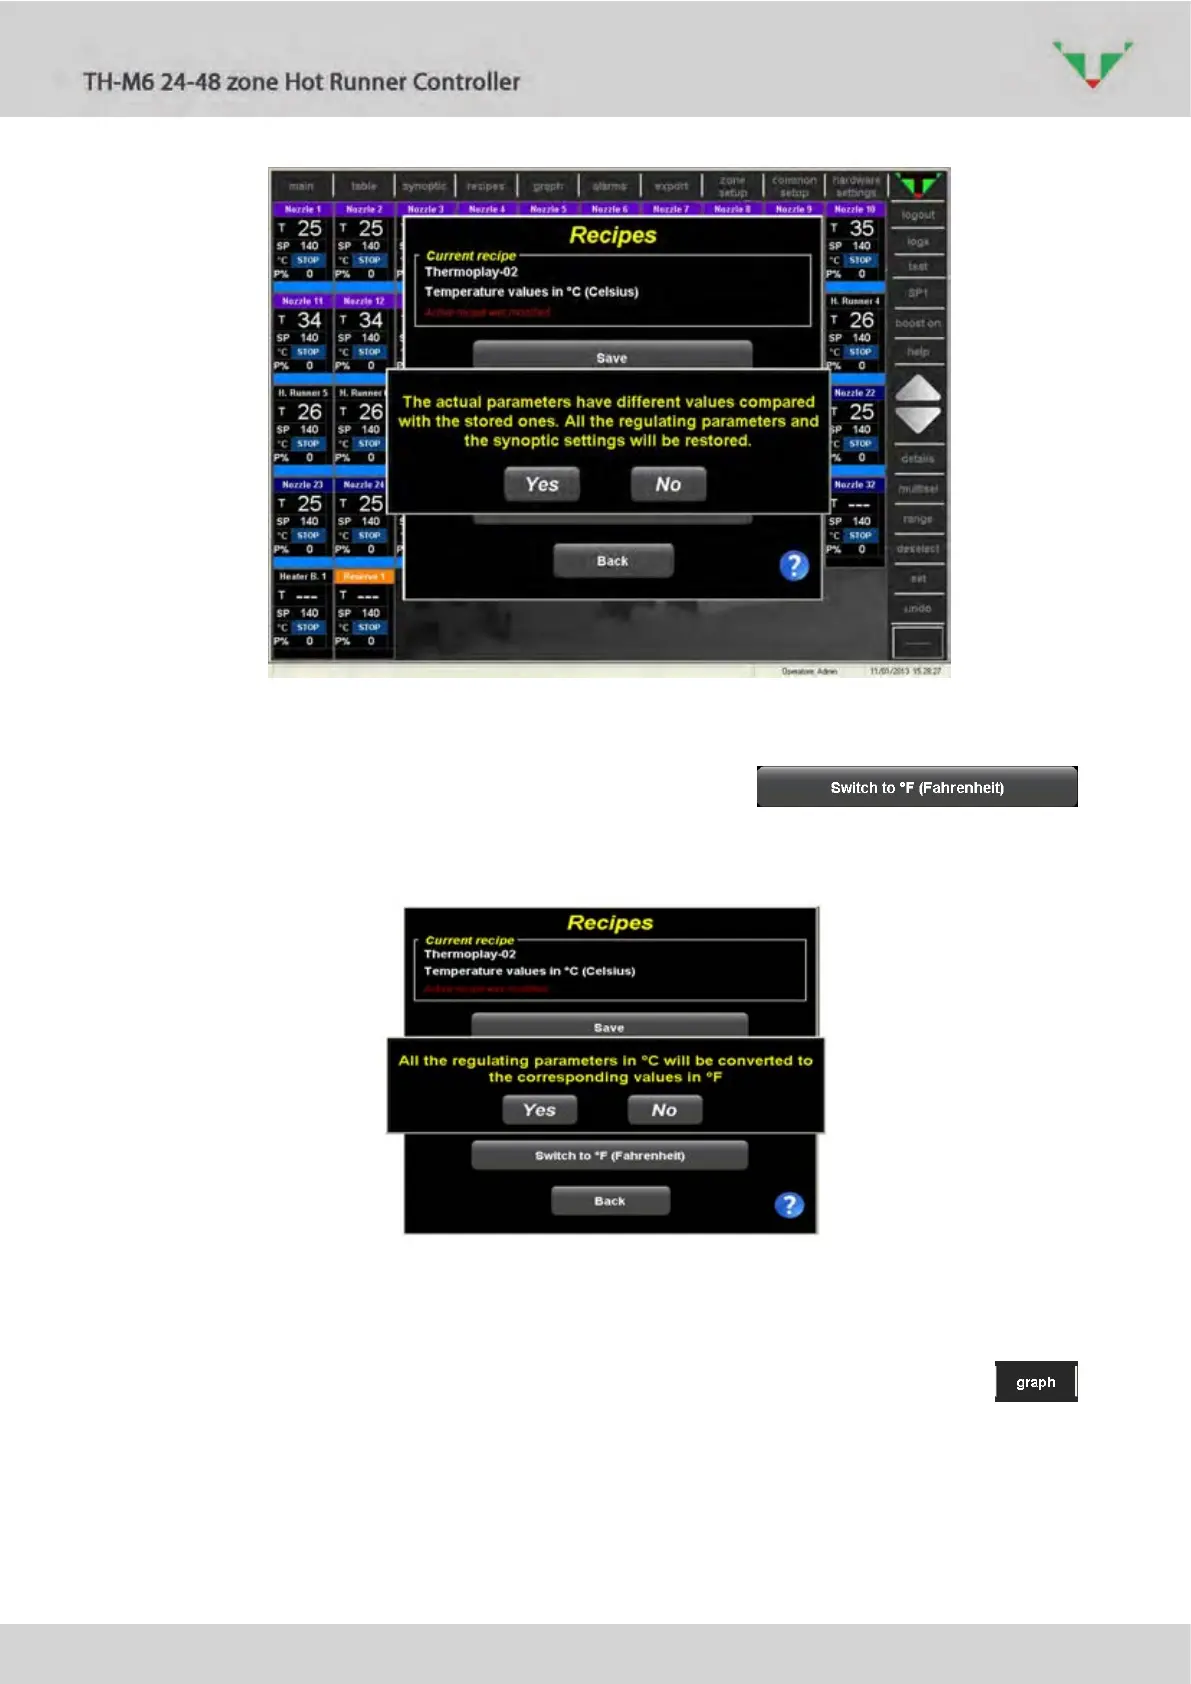
Figure 53
6.11.4 Celsius – Farenheit conversion
In the menu of Figure 47, if controller is in “STOP” mode, the
button allows to convert all the values of the regulating parameters to the corresponding value
in °F. Confirmation is required.
Figure 54
6.12 “graph” environment
In this page it’s possible to graph the values of temperature, Set Point and power versus time
of some zones. In ”main” or “table” page select the zones of interest, then click on
button. In the two graph (Figure 55) are displayed the trends relative to the zone selected in the
left side list. Average power is calculated according to the common parameter “Time for
calculation of average power” Idx 35.