AHB2 Instruction Manual Rev F Page 29
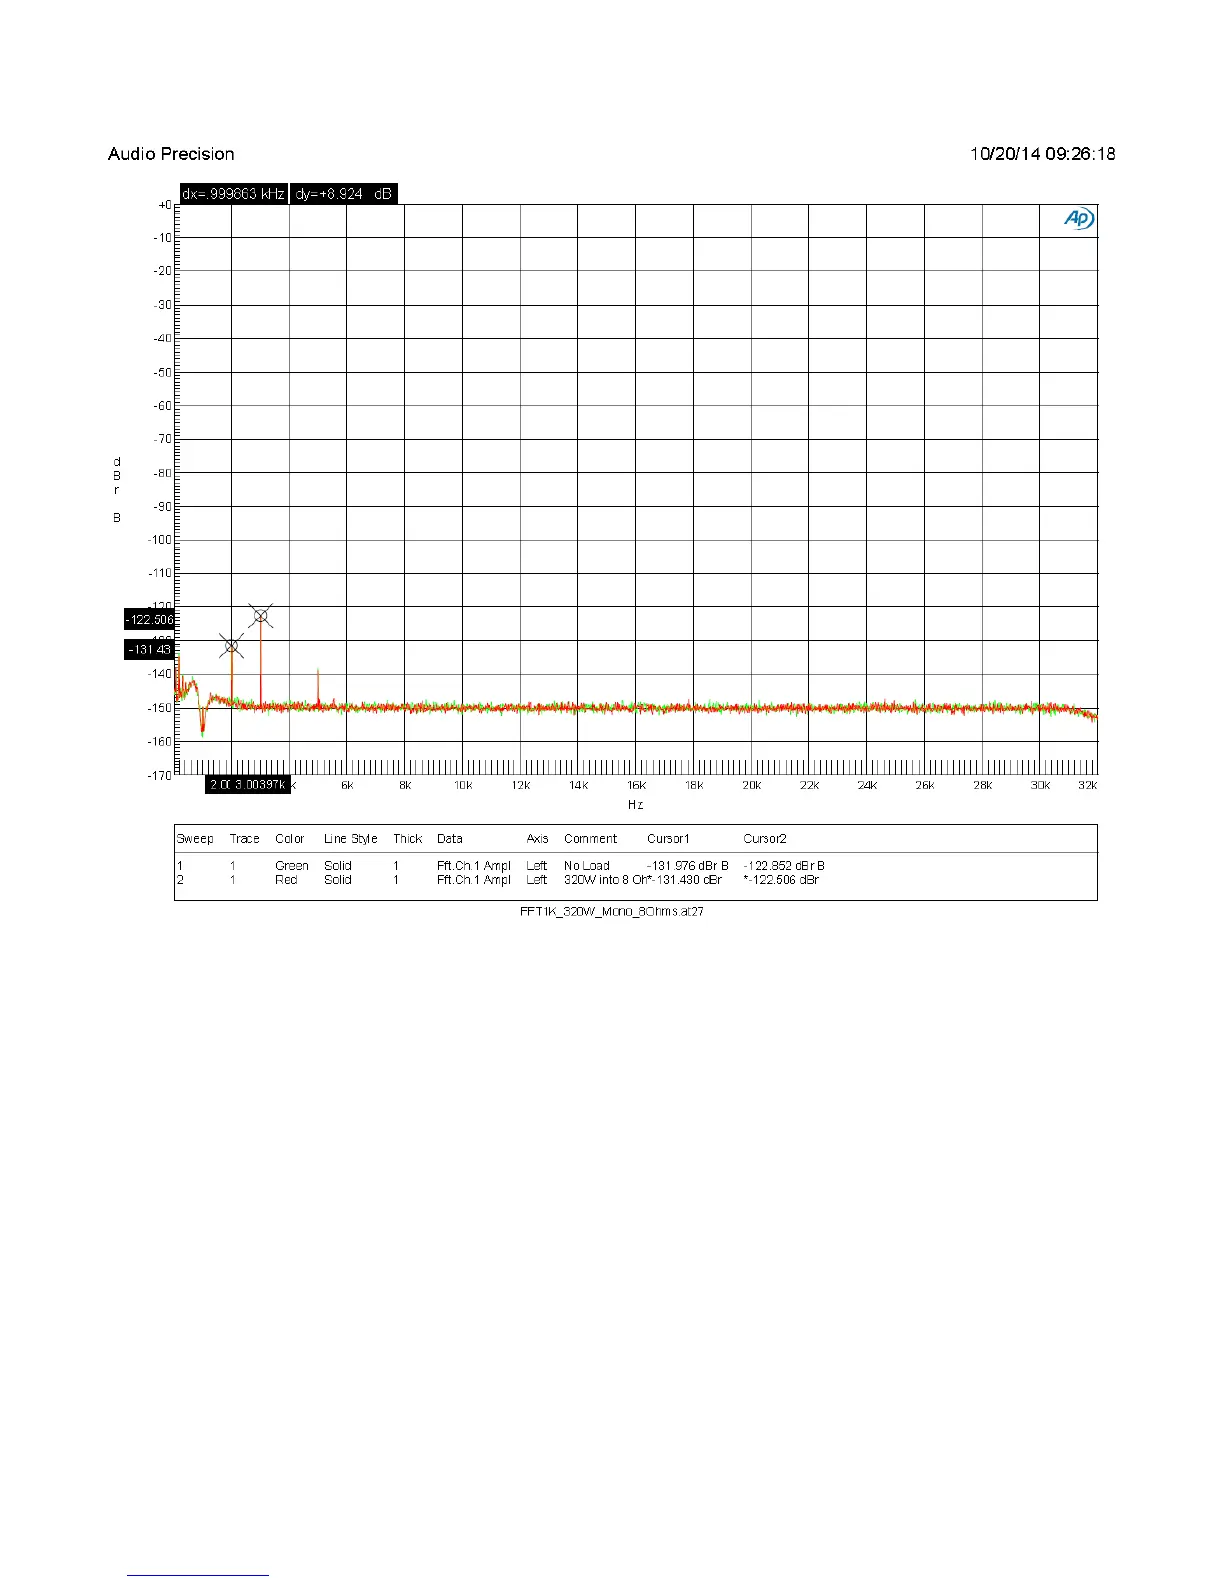
Figure 5 – FFT at 320W, 1 kHz, 8-Ohms Bridged Mono
This FFT plot shows the spectral purity of the AHB2. The green trace is the no-load performance.
The red trace is the performance at 320 W. Both are nearly identical. The 1 kHz fundamental has
been removed with a notch filter to improve the resolution of the AP2722 test set. The 2nd
harmonic measures -131.5 dB relative to the 1 kHz fundamental. The 3rd harmonic measures
-122.5 dB relative to the 1 kHz fundamental. The only other harmonic visible is the 5th and this
measures about -139 dB relative to the fundamental.