Instruction Manual for LA4 with 1.0.X Firmware – REV A Page 31
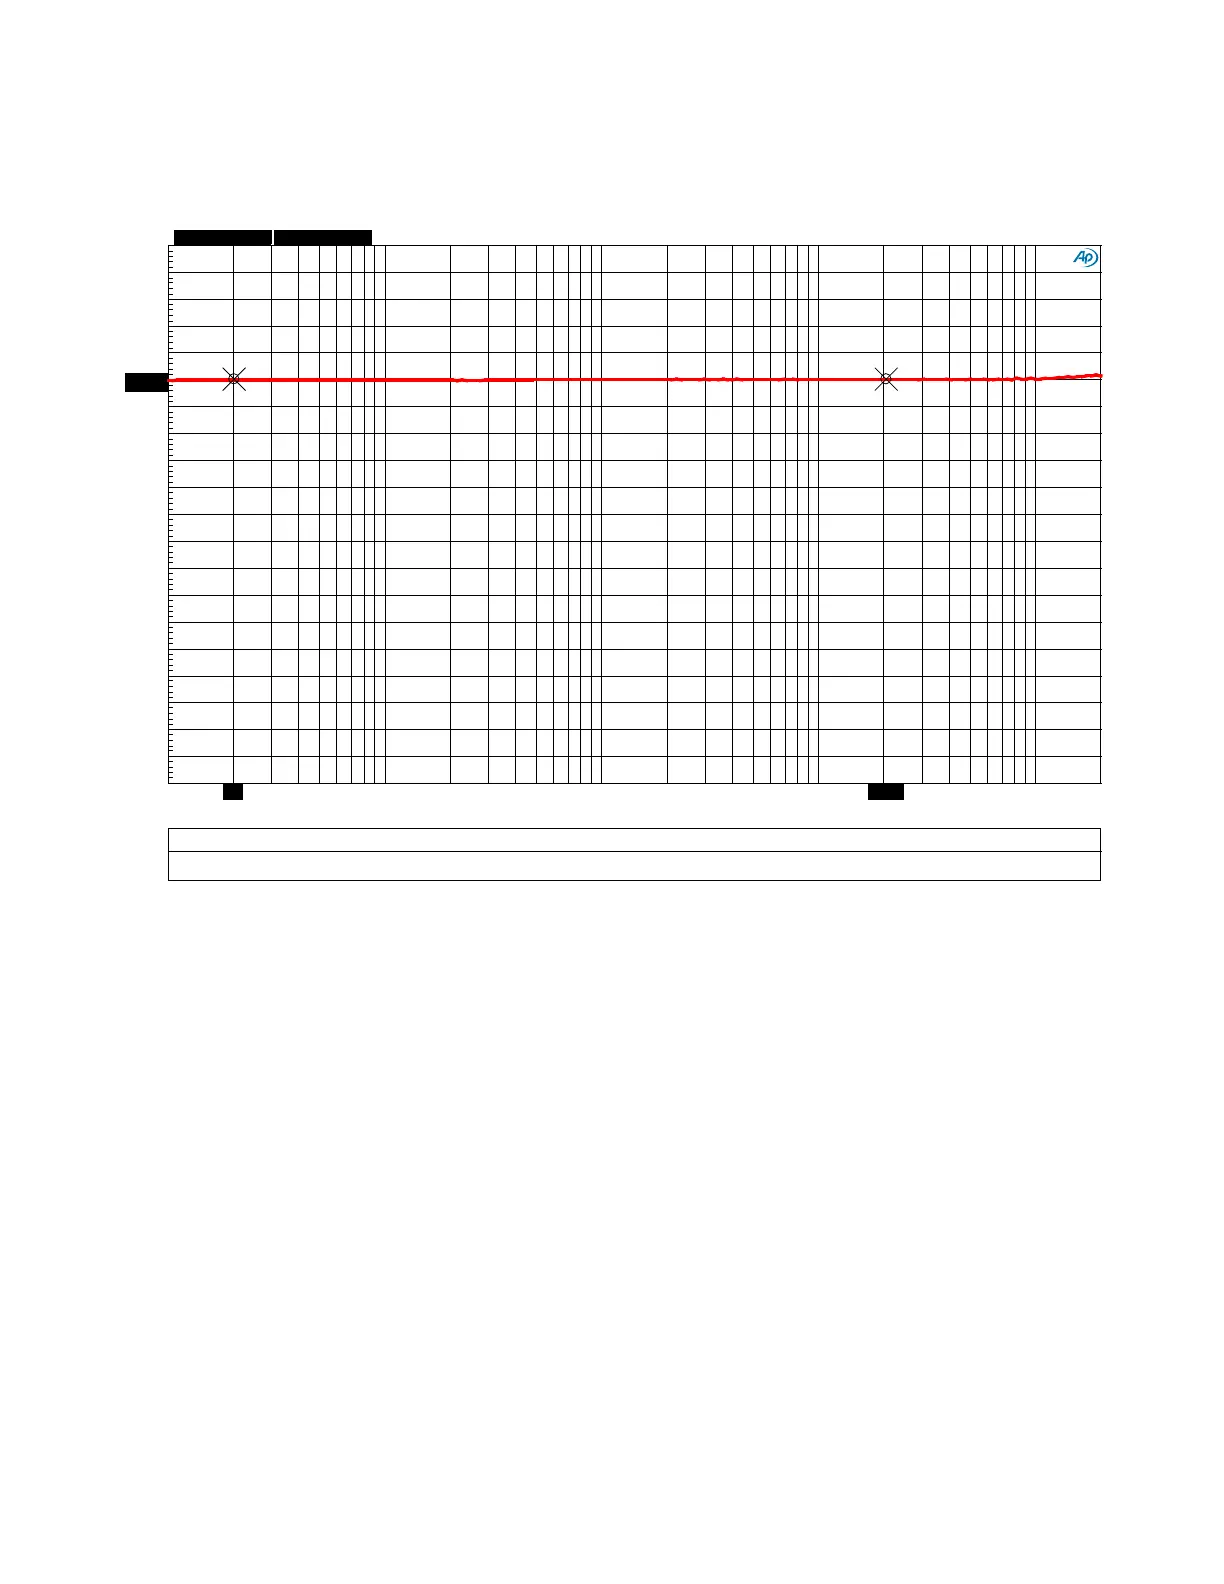
Graph 3 - Frequency Response
The -3 dB frequency response of the line amplifier extends from about 0.1 Hz to 500 kHz. This is
well beyond the 10 Hz to 200 kHz range of our AP2722 measurement system. Over our 10 Hz to
200 kHz measurement range, the frequency response is perfectly flat.
The primary advantage of this wide frequency response is that it delivers a very precise phase
response. Low bass is delivered with precise timing relative to the highest audible frequencies (and
everything in between). Furthermore, the extreme bandwidth keeps the L/R differential phase
nearly perfect. The result is an unrivaled stereo image with accurate placement of musical voices
within a 3D sound stage.
Notes:
• The scale on the left (dBr A) is dB relative to the output level at 1 kHz. The test used a
0-dBu test tone. The small +/- 0.003 dB random variations shown are due to the
measurement limitations of the AP2722.
• Balanced inputs to balanced line outputs, volume control set at 0 dB.
ColorSweep Trace Line Style Thick
Data Axis Comment
Cursor1 Cursor2
1
1 Red
Solid 4 Anlr.Level A Left Line Out *+0.003 dBr *+0.003 dBr
-3
+1
-2.8
-2.6
-2.4
-2.2
-2
-1.8
-1.6
-1.4
-1.2
-1
-0.8
-0.6
-0.4
-0.2
+0
+0.2
+0.4
+0.6
+0.8
10
200k
20 50
100
200
500 1k
2k
5k 10k
20k
50k
100k
20.5k
20