Instruction Manual for LA4 with 1.0.X Firmware – REV A Page 32
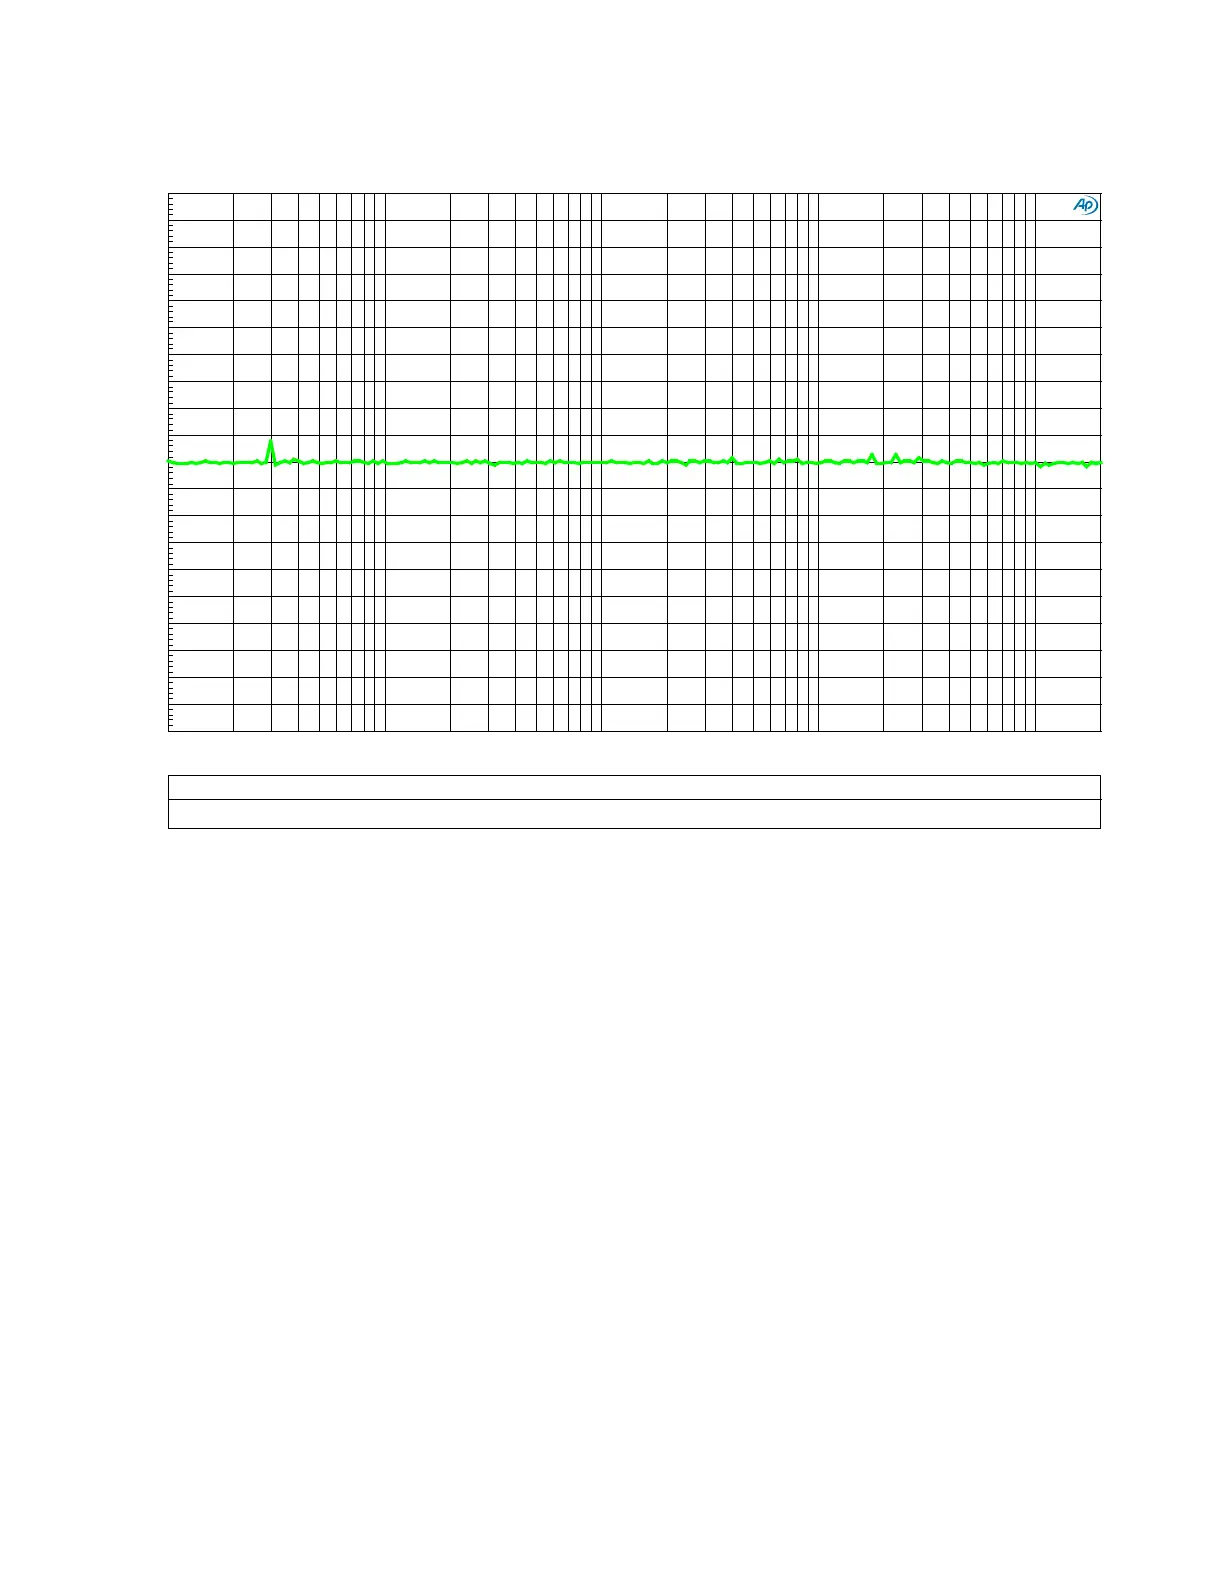
Graph 4 - Differential Phase
This plot shows the differential phase between the left and right channels. The extended 0.1 Hz to
500 kHz frequency response keeps the phase response of the two channels well matched over the
audio band. This plot shows that the differential phase is virtually perfect! Notice that the scale is
highly expanded (+/- 1 degree). The slight bumps in the curve are due to the measurement limits
of the AP2722 test station. This L/R phase matching is much better than the L/R phase matching in
the AP2722 test station. To make this measurement, we had to create a correction curve for the
AP2722. The correction curve removes the phase errors produced by the test equipment, allowing
measurement of the line amplifier.
Notes:
• The vertical scale is the phase difference between the left and right channels.
• Balanced inputs to balanced outputs, volume control set at 0 dB.
Differential_Phase_Bal_Bal.at27
ColorSweep Trace Line Style Thick Data Axis Comment
1 1 Green Solid 4 Anlr.Phase!Delta Left
-1
+1
-0.9
-0.8
-0.7
-0.6
-0.5
-0.4
-0.3
-0.2
-0.1
+0
+0.1
+0.2
+0.3
+0.4
+0.5
+0.6
+0.7
+0.8
+0.9
10 200k
20 50 100
200 500
1k 2k 5k 10k 20k
50k
100k