Instruction Manual for LA4 with 1.0.X Firmware – REV A Page 36
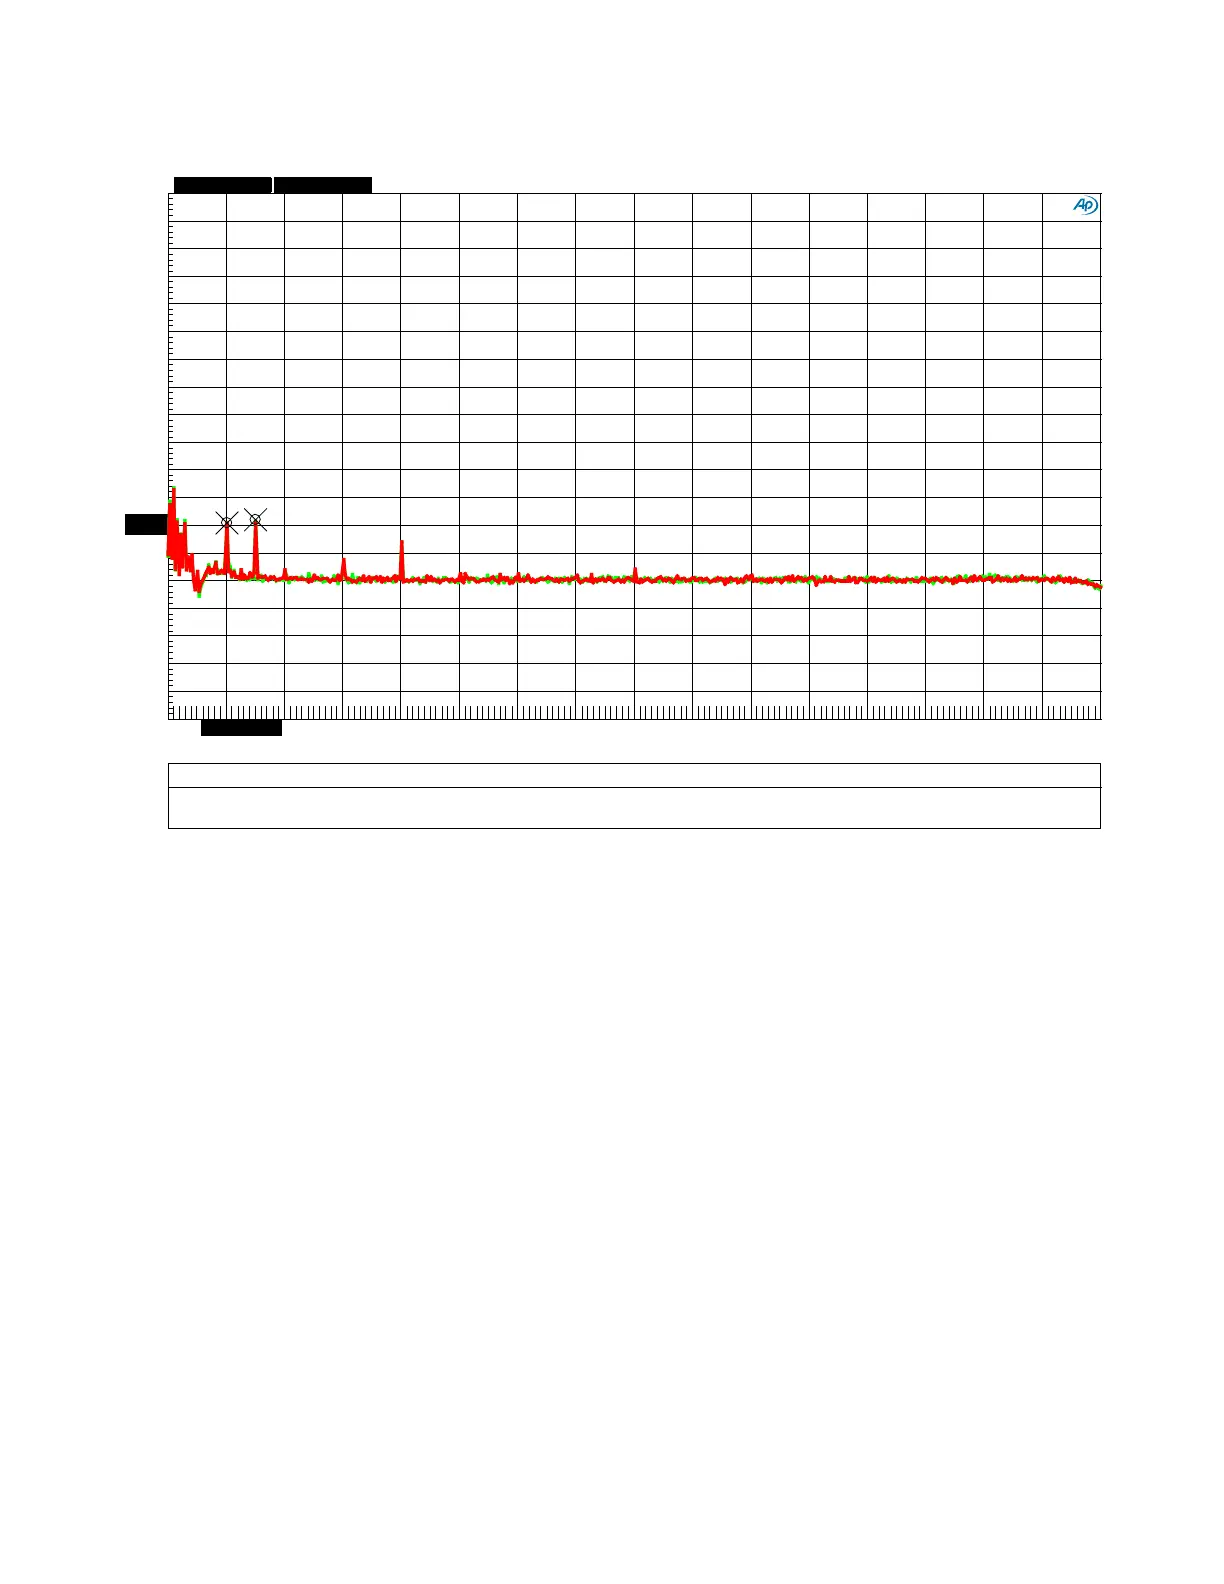
Graph 8 - FFT 1 kHz Tone at 1.6 Vrms - Line Amplifier - Unbalanced to Unbalanced
This plot shows the performance of the unbalanced inputs and outputs. The input level is 1.6 Vrms
which is the level required to produce 22 dBu on the balanced outputs. This level was selected to
match the operating point used in Graph 7.
If you compare Graph 8 (unbalanced) to Graph 7 (balanced) you can see that the unbalanced
inputs and outputs perform very well in terms of THD. However, the SNR is slightly reduced due to
the much lower signal levels used with unbalanced interconnects.
Notes:
• The scale on the left (dBr B) is dB relative to 1.6 Vrms. It is also the level of the test tone.
• Unbalanced inputs to unbalanced line outputs, volume control set at 0 dB.
• The 1 kHz fundamental has been removed using a notch filter. This filter increases the
resolution of the AP2722 test system.
ColorSweep Trace Line Style
Thick Data Axis Comment Source 2
Cursor1 Cursor2
1
2 Green
Solid 4
Fft.Ch.1 Ampl Left L RCA Out
: 5.00000 =Swr.Ch. A Input *-119.172 dBr *-118.128 dBr
2 2
Red Solid 4
Fft.Ch.1 Ampl Left R RCA Out : 6.00000 =Swr.Ch. A Input
-118.981 dBr B -118.977 dBr B
-190
+0
-180
-170
-160
-150
-140
-130
-120
-110
-100
-90
-80
-70
-60
-50
-40
-30
-20
-10
2k
32k
4k
6k
8k
10k
12k
14k
16k
18k
20k
22k
24k
26k
28k
30k
2.01329k3.01493k