1 689 979 943 2008-09-03| Robert Bosch GmbH
14 | BAT 415 | Product descriptionen
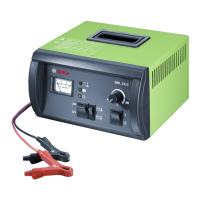
Function description3.7
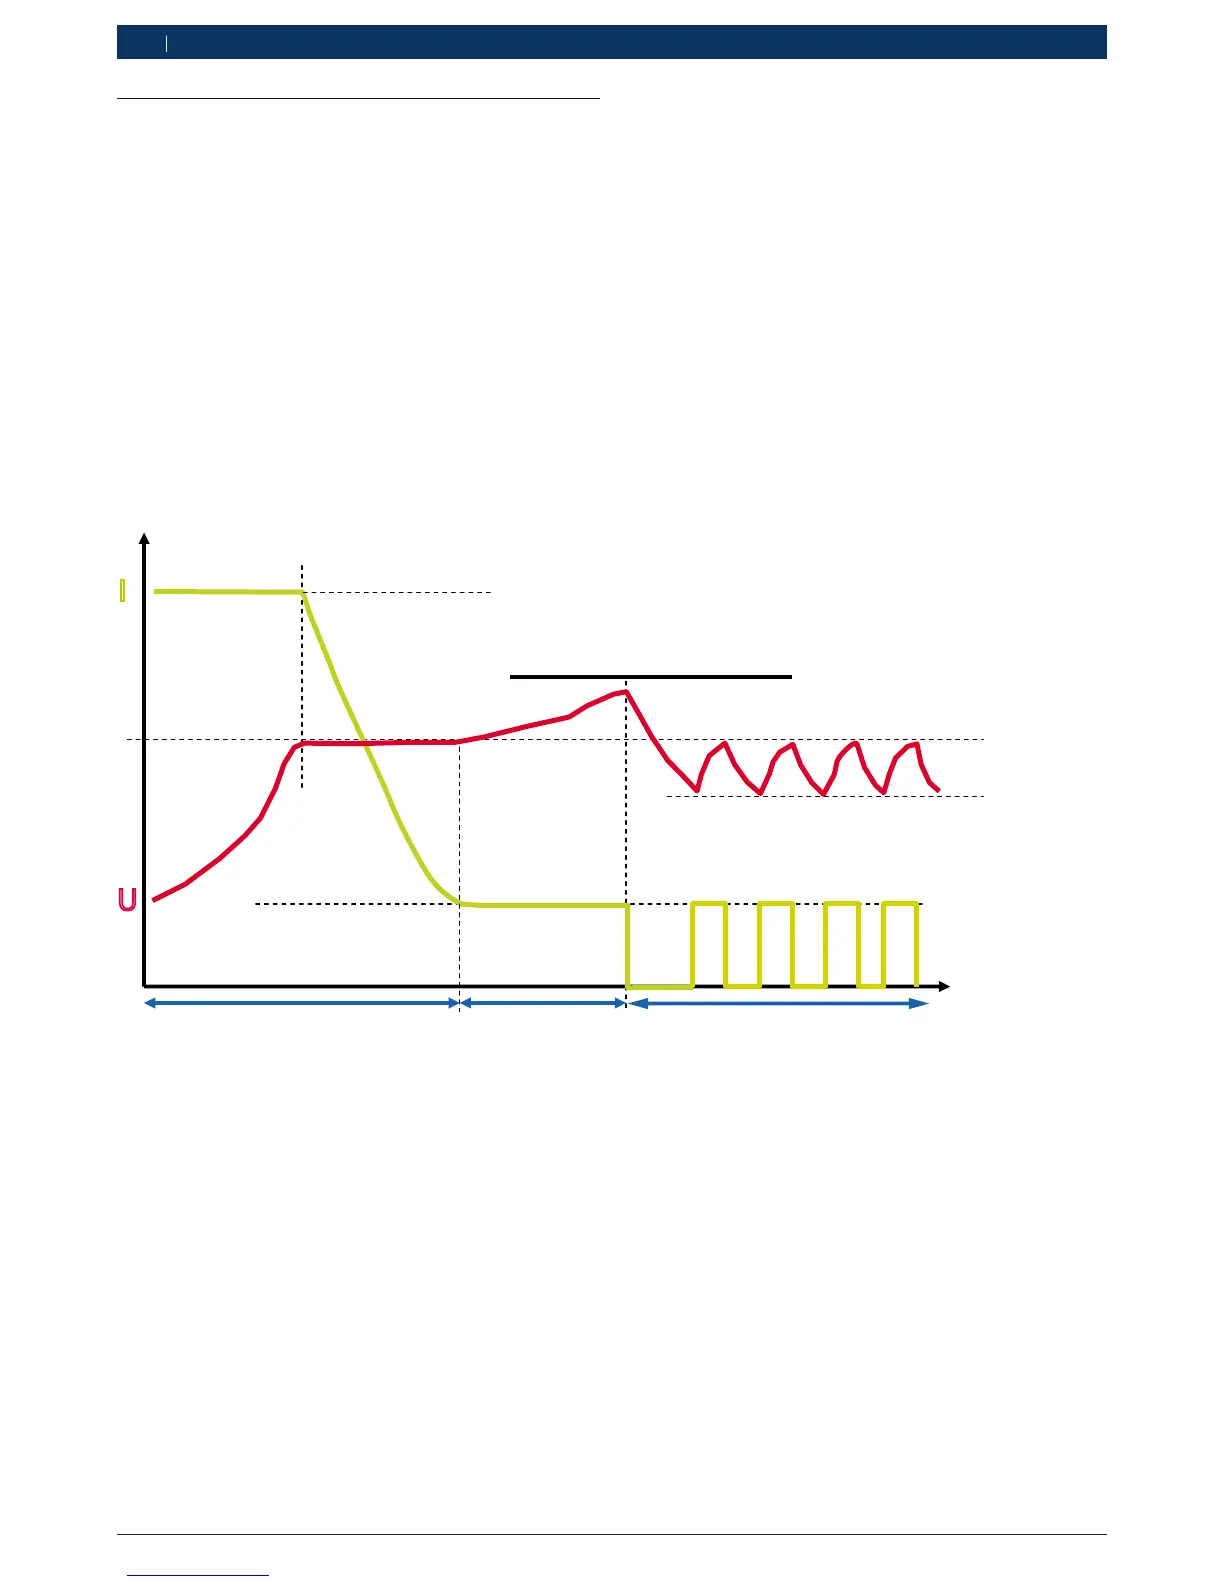
Figure 2 shows the characteristic charging curve for the
BAT 415.
In phase 1 of the charging process, the charging current
I
1
is approx. 15 % of the battery capacity set on the cont-
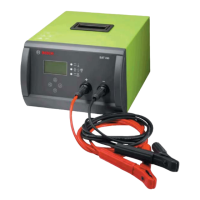
roller (Fig. 1, item 8). The green LED flashes rapidly.
When the battery has reached the final charge voltage
U
1
, the charging current I
1
starts to fall. Around 65 %
of the battery capacity has now been reached. The
battery can be used as a starter battery. Phase 1 (main
charging) is complete when the charging current I
1
falls
below approx. 1% of the battery capacity. The battery is
then approx. 97 % charged.
BAT 415 characteristic charging curveFig. 2:
Characteristic charging curve
t
U
I
Phase 1
Phase 2
U
1
Warm = 14,0V
U
1
Cold = 14,4V
I
1
= 15% of Ah controller
I
2
= 1% of Ah controller
U
2
U
3
= 12,7V
Phase 3
Warm = 14,4V
Cold = 14,8V
U
2
Green LED flashes rapidly
Green LED flashes slowly
Green LED constantly lit
In phase 2, the charging current I
2
is approx. 1 % of the
set battery capacity. The green LED flashes slowly. Pha-
se 2 is time-controlled and lasts for 65 % of the main
charging time (phase 1). The charge voltage is limited to
U
2
. At the end of phase 2 the green LED is constantly lit.
Example: With a set battery capacity of 80 Ah, the char-
ging current I
1
is approx. 12 A and the charging current
I
2
is approx. 0.8 A.
In phase 3, the charging current is always activated
if the battery is below the voltage U
3
. The charging
current remains active until the charge voltage U
1
is
reached.