About
frequency
equalization
The front panel has
20
controls.
10
per channel. Each
control varies by
-c
15
dB the level of a small range of au-
dio frequencies which is centered around the trequency
marked over each control. In order to achieve a smooth
response, controls lor adjacent frequencies within each
channel must interact. For example, the
LEFT
500
Hz
control will affect the
LEFT
1
kHz control.
The
net effect
of such controls set in the same direction (both in
+
or
both in
-)
will be greater than the panel marking indi-
cates. The effect
of such controls in opposite directions
(one
+
and one
-)
.will be less than indicates. Refer to
R
gures in
Total
system equalization that follow for typical
slide control effect.
LED
illumination of the
FREQUENCY
level controls incor-
porated provides a visual display
ot the controls, depict-
ing graphically the curves you have created, to assist in
tailoring the frequency response to your preference.
The
musical spectrum
The Approximate frequency ranges chart
on
next page
correlates familiar musical instruments with the numeri-
cal fresuencies that they produce. Given the often talked
about musical range of 20
Hz
to
20
kHz, it is surprising to
see how low musical fundamentals actually are. (Almost
all are under 3,500
Hz.)
It should be understood however
that if all instruments were perceived only by their funda-
mental frequency output (black bands), they would all
sound alike. It is the harmonics or overtones (grey
bands) that give each individual instrument its character
or timbre and set it apart from the rest.
Interestingly enough, the human ear is more sensitive to
certa~n octaves in the musical spectrum than to others.
Whoever designed this engineering marvel deemed it ne-
cessary
to
tune the ear more toward the midrange fre-
quencies where speech and voice communication occur
than to the outer octaves of low bass and
hlgh musical
overtones. As a result, very
small energy changes
here
will cause a more drastic psychoacoustic effect than
larg~r changes would at the frequency extremes.
In order
lo discuss the qualitative effects of adjustment in
tonal balance,
it
is best to arbitrarily divide the musical
spectrum into five ranges.
The
bass
(approx.
20
-
140
Hz). There is little musical
materiai with fundamental frequencies below about
60
Hz, and what is normally perceived as low bass material
is actually
in
the 60
-
140
Hz
range. The very lowest ire-
quency controls
can
be used
to
enhance output for the
few instruments in that range (organ, contrabassoon,
etc.)
or they can
be
used to reduce rumble, acoustic
feedback and other low frequency aberratrans. A control
in
what
is
normally labeled the 60
-
90
Hz
area will usual-
ly cause
ihe greatest perceptible changes in "bass re-
sponse".
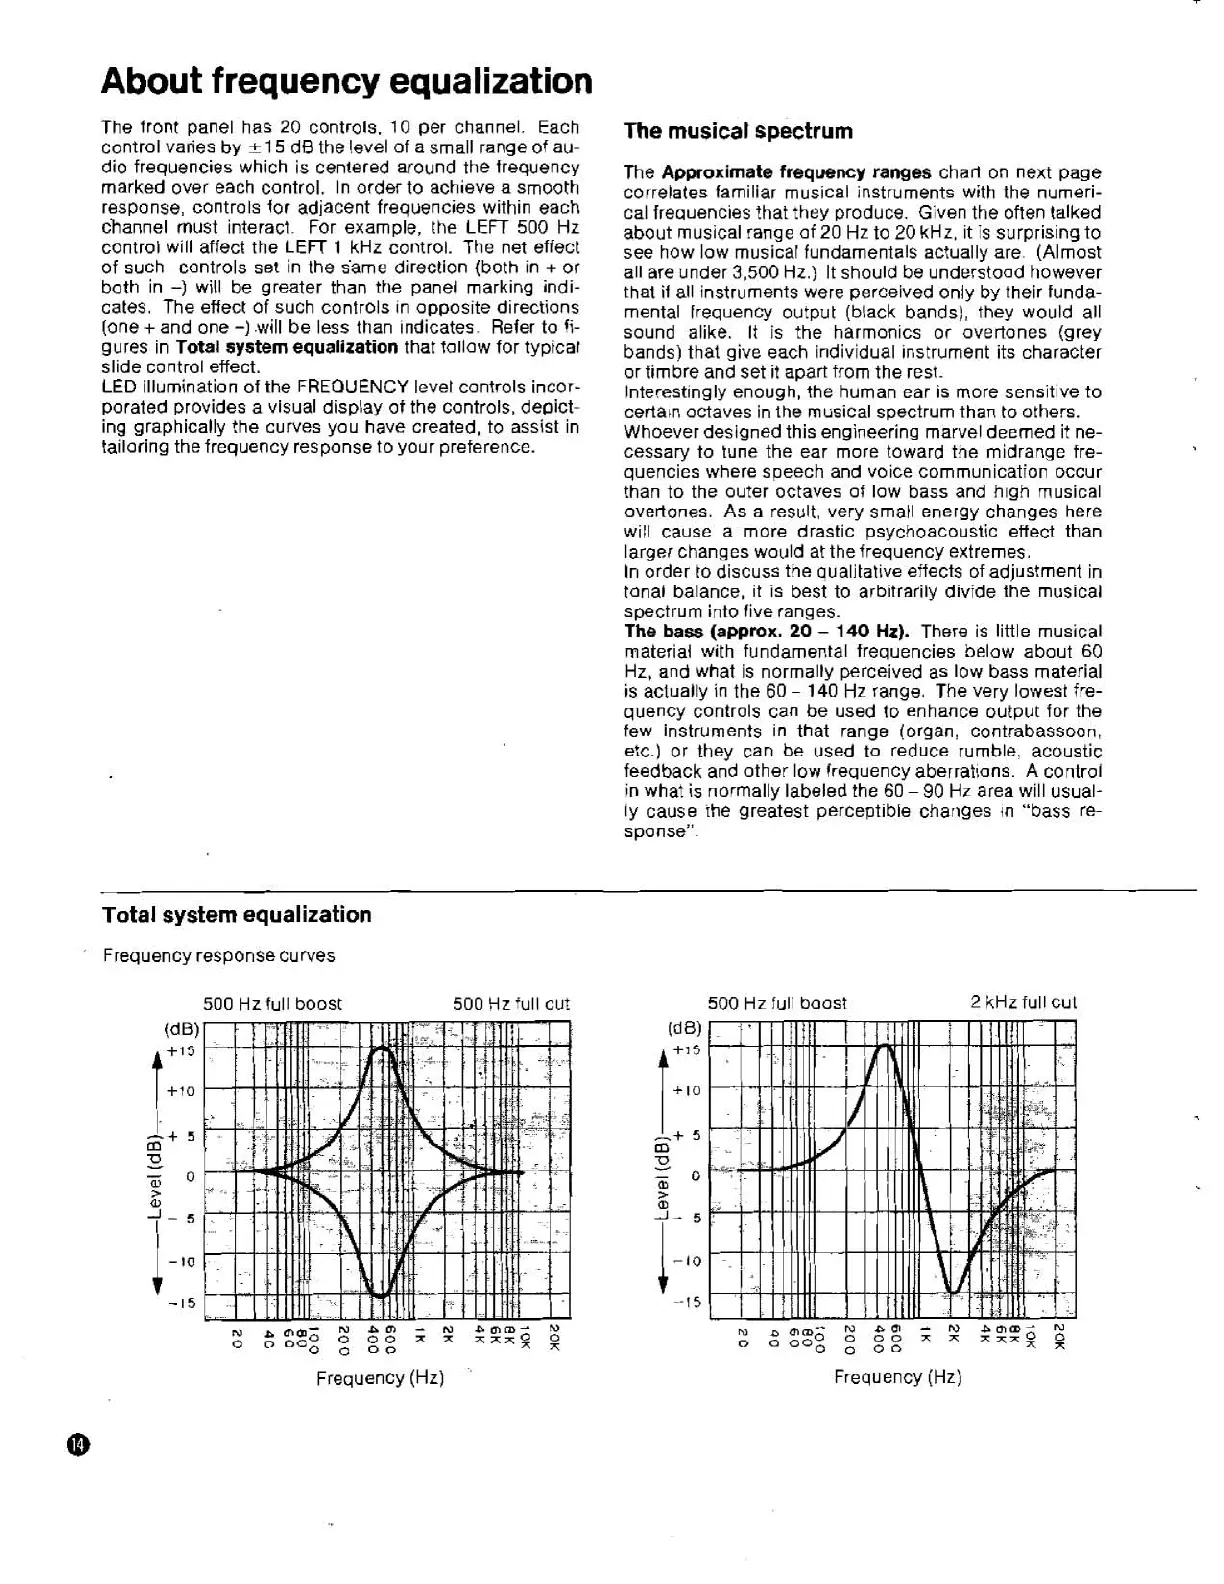
Total
system equalization
Frequency response curves
500
Hzfull boost 500
Hz
full cut
Frequency
(Hz)
500
Hz full boost
2
kHzfull cut
 Loading...