SECTION 6: REPORTS ®
making
since 1986
ater work
6F. STATION HISTORY
The Station History report section of the controller
allows you to view individual station irrigation
information which include the following:
• Date and time irrigated
• Program station assigned to
• Number of cycles
• Programmed minutes
• Minutes applied
• Inches applied
• High flow limit
• Low flow limit
• Actual flow
• Minutes of Hold-Over
• Applicable Flag letter alerts
(See Enclosure 2)
From the REPORTS menu screen (Figure 6.2):
1.
Press the STATION HISTORY
Menu key.
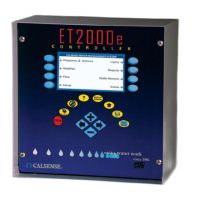
The STATION HISTORY screen is displayed
(Figure 6.10).
STATION 1 HIST ORY
Date & Time PRG CYC MIN MIN GAL
PROG APPLIED
11/21 2:20PM A 1 4.0 4.0 96
11/18 2:20PM A 1 4.0 4.0 96
11/14 2:20PM A 1 4.0 4.0 96
11/20 2:20PM A 1 4.0 4.0 96
Page Right
11/13 2:20PM A 1 4.0 4.0 96
11/11 2:20PM A 1 4.0 4.0 96
11/07 2:20PM A 1 4.0 4.0 96
11/07 2:20PM A 1 4.0 4.0 96
Figure 6.10
2.
Press the PLUS or MINUS keys
to scroll up and down the screen
to view additional information.
3.
Press the PAGE LEFT Menu key
to view the next screen
(Figure 6.11).
STATION 1 HIST ORY
Date & Time HI GPM LO SET READ FLAG
:- - FLOW- - - : MOISTURE
11/21 2:20PM 19 24 29 99 41
11/19 2:20PM 19 24 29 99 41
11/17 2:20PM 19 24 29 99 41
11/20 2:20PM 19 24 29 99 41
Page Left
11/16 2:20PM 19 24 29 99 41
11/10 2:20PM 19 24 29 99 41
11/09 2:20PM 19 24 29 99 41
11/08 2:20PM 19 24 29 99 41
Figure 6.11
4.
Press the PAGE RIGHT Menu
key to view the previous screen
(Figure 6.10).
THIS CONCLUDES THE STATION HISTORY
SECTION
6G. USE VS. BUDGET
The Use Vs. Budgets option is only available if
budgets are turned on in the controller under the
weather menu.
This section of the controller allows you to view the
predicted outcome for the month based on your
current controller settings.
From the REPORTS menu screen (Figure 6.2)
1.
Press the USE VS. BUDGET
Menu key.
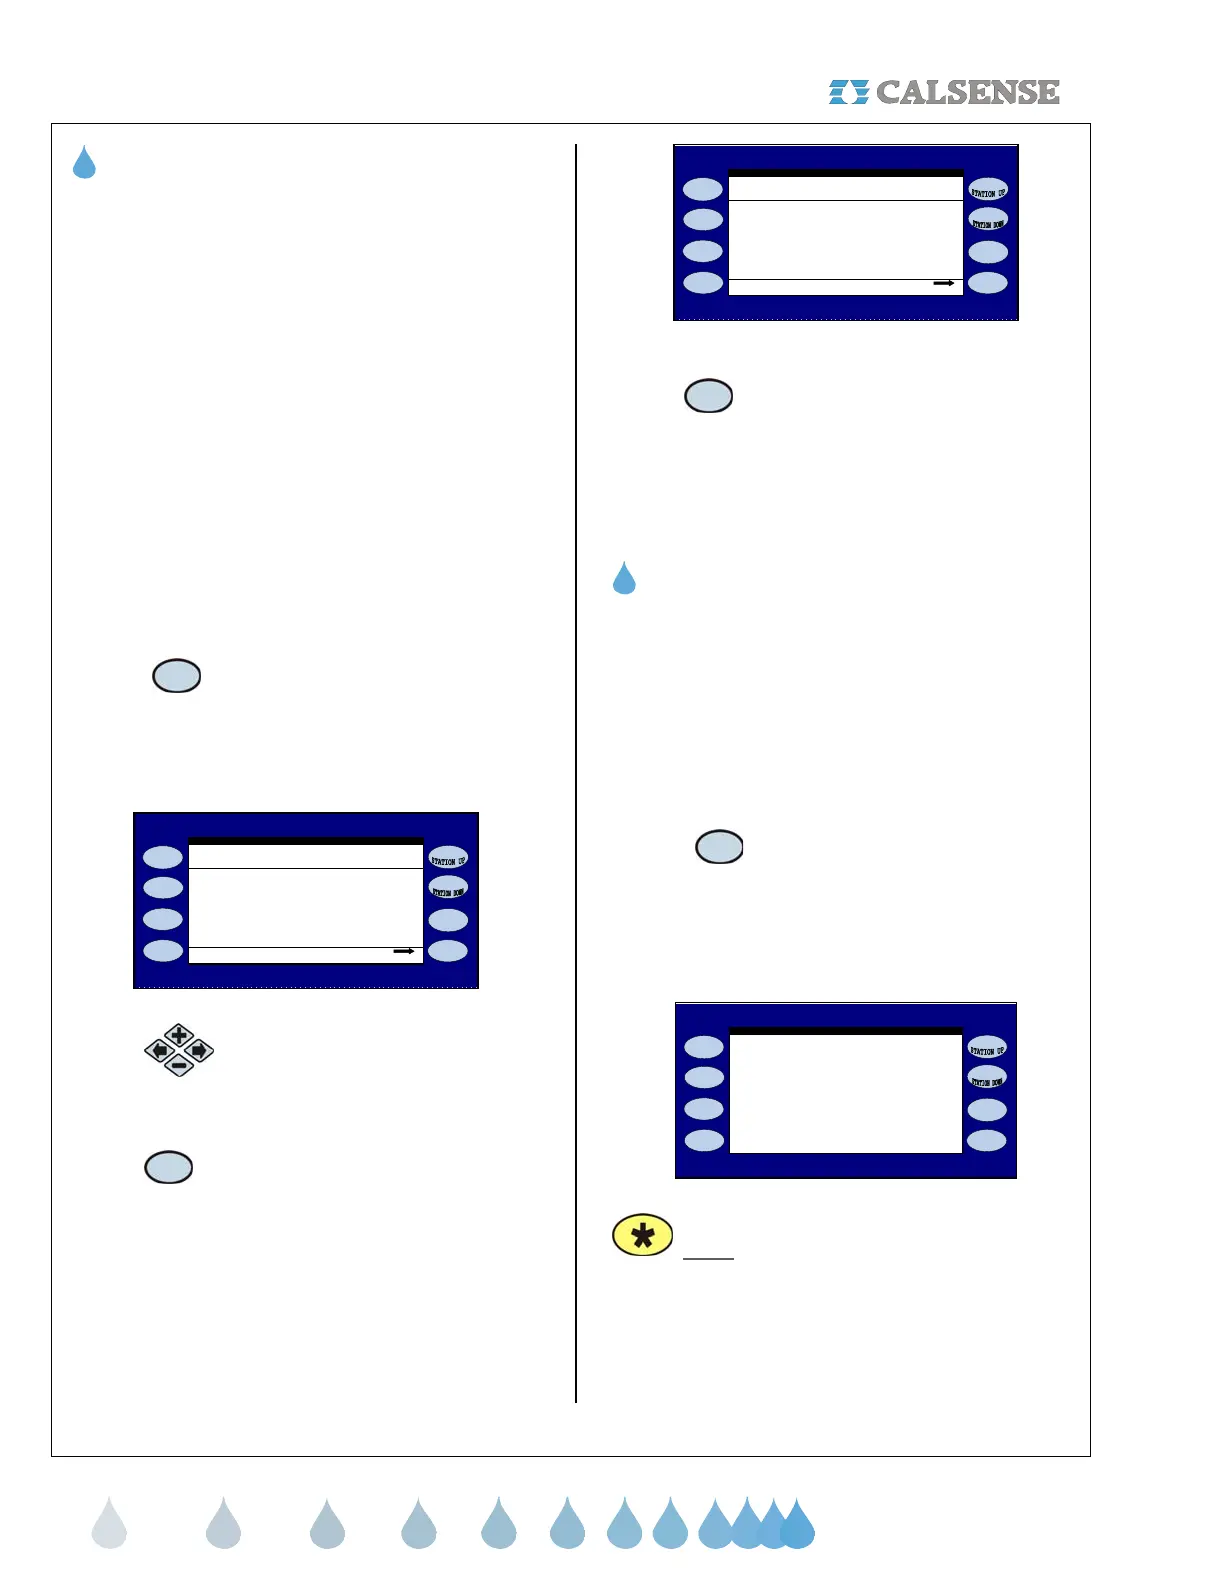
The PERFORMANCE TO BUDGET screen is
displayed (Figure 6.12).
the irrigation schedule along with
your Test and manual usage pattern.
NOTES:
1) Use & Expected are Scheduled plus Test
plus Manual.
2) The Expected use takes into account
Use From Start of Month : 9866 gal
Expected for April : 12851 gal
PERFORMANCE TO BUDGET
pril Budget : 18383 gal
Figure 6.12
Note: You can press the STAR key to
change the view on the screen from Gallons
to Hundreds of Cubic Feet and back again.
THIS CONCLUDES THE USE VS. BUDGET
SECTION