112
Statistical Graphs and Calculations Chapter 7
While the statistical data list is on the display, perform the following procedure.
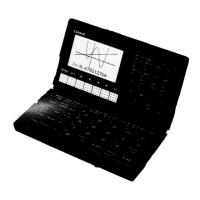
!Z
2(Man)
Q(Returns to previous menu.)
1(GRPH)1(GPH1)
Here we will illustrate this operation by making histogram settings for Graph 1.
The following are the meanings of the items that appear in this screen.
Strt.................. Histogram start point (x-coordinate)
ptch ................ Bar spacing (specify as scale unit)
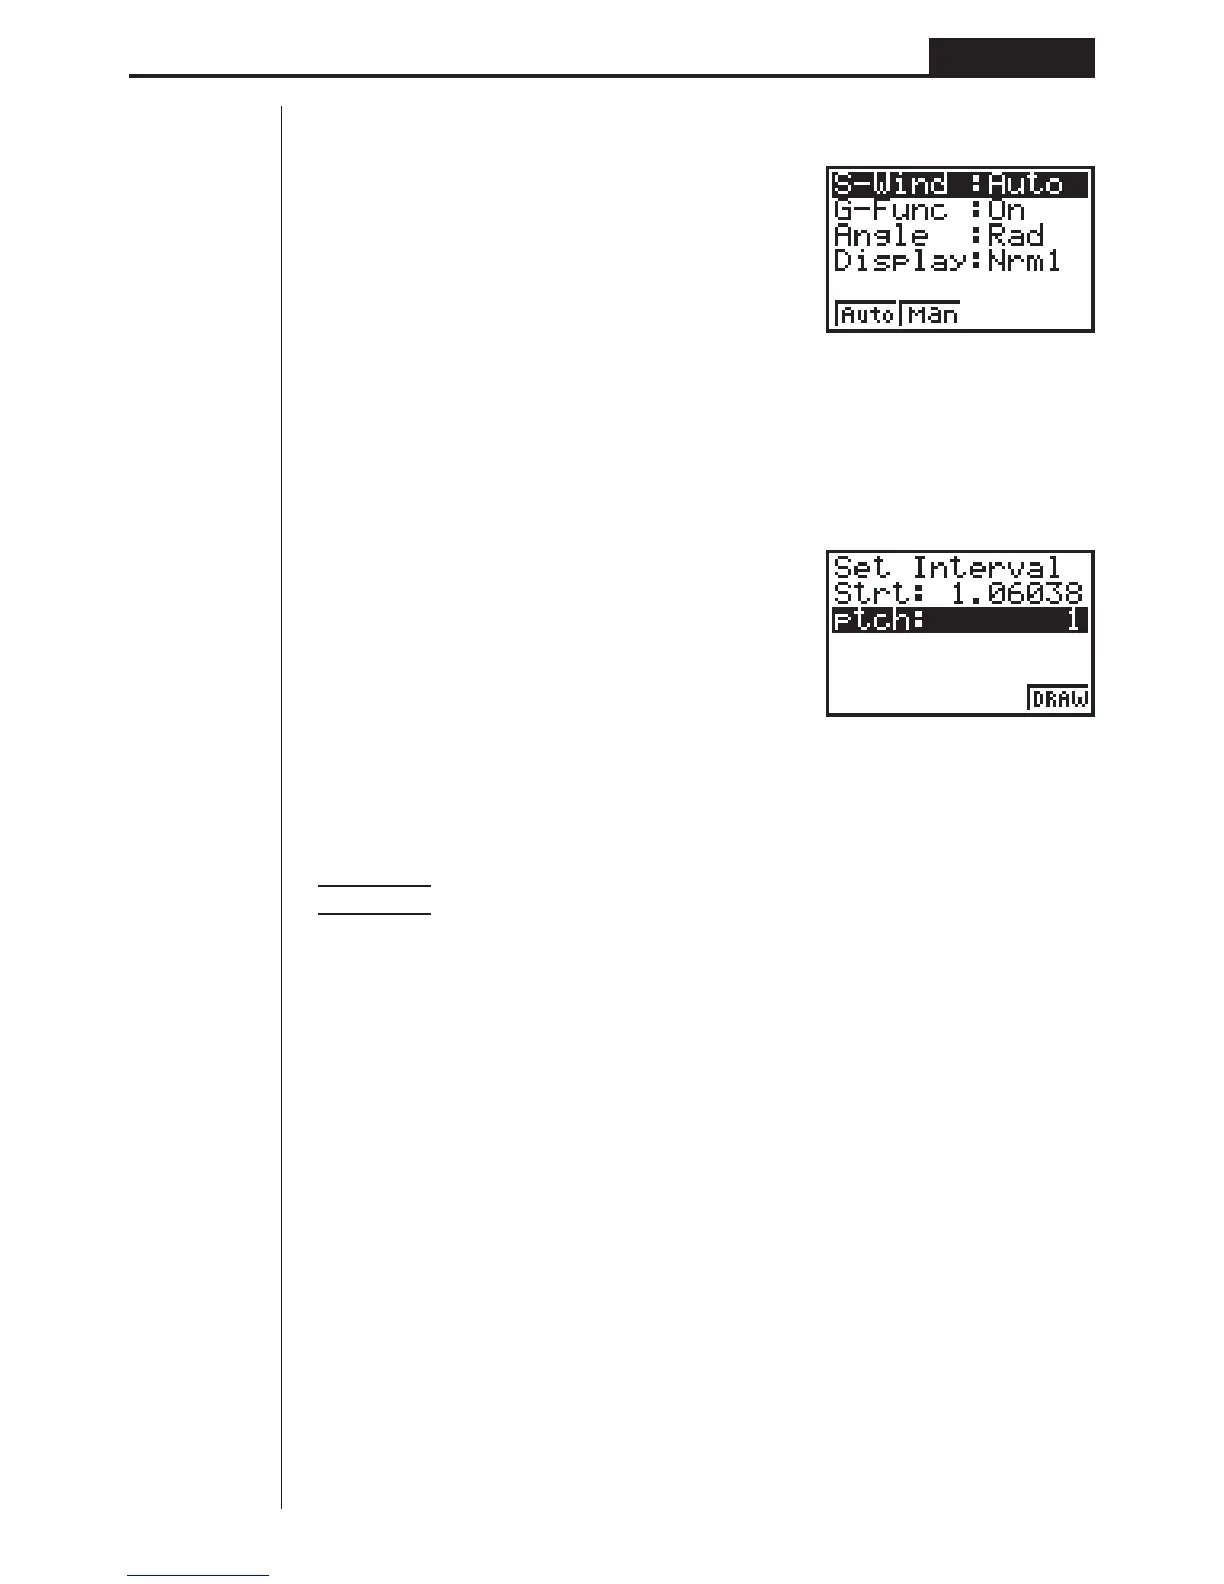
Example Strt: 0, ptch: 10
While the statistical data list is on the display, perform the following procedure.
!Z2(Man)
Q(Returns to previous menu.)
1(GRPH)1(GPH1)
aw(Start value is
x = 0.)
baw(pitch = 10)
1 2 34