75
Table and Graph Chapter 5
5. Editing a Table
You can use the editing screen to add lines to or delete lines from an existing table.
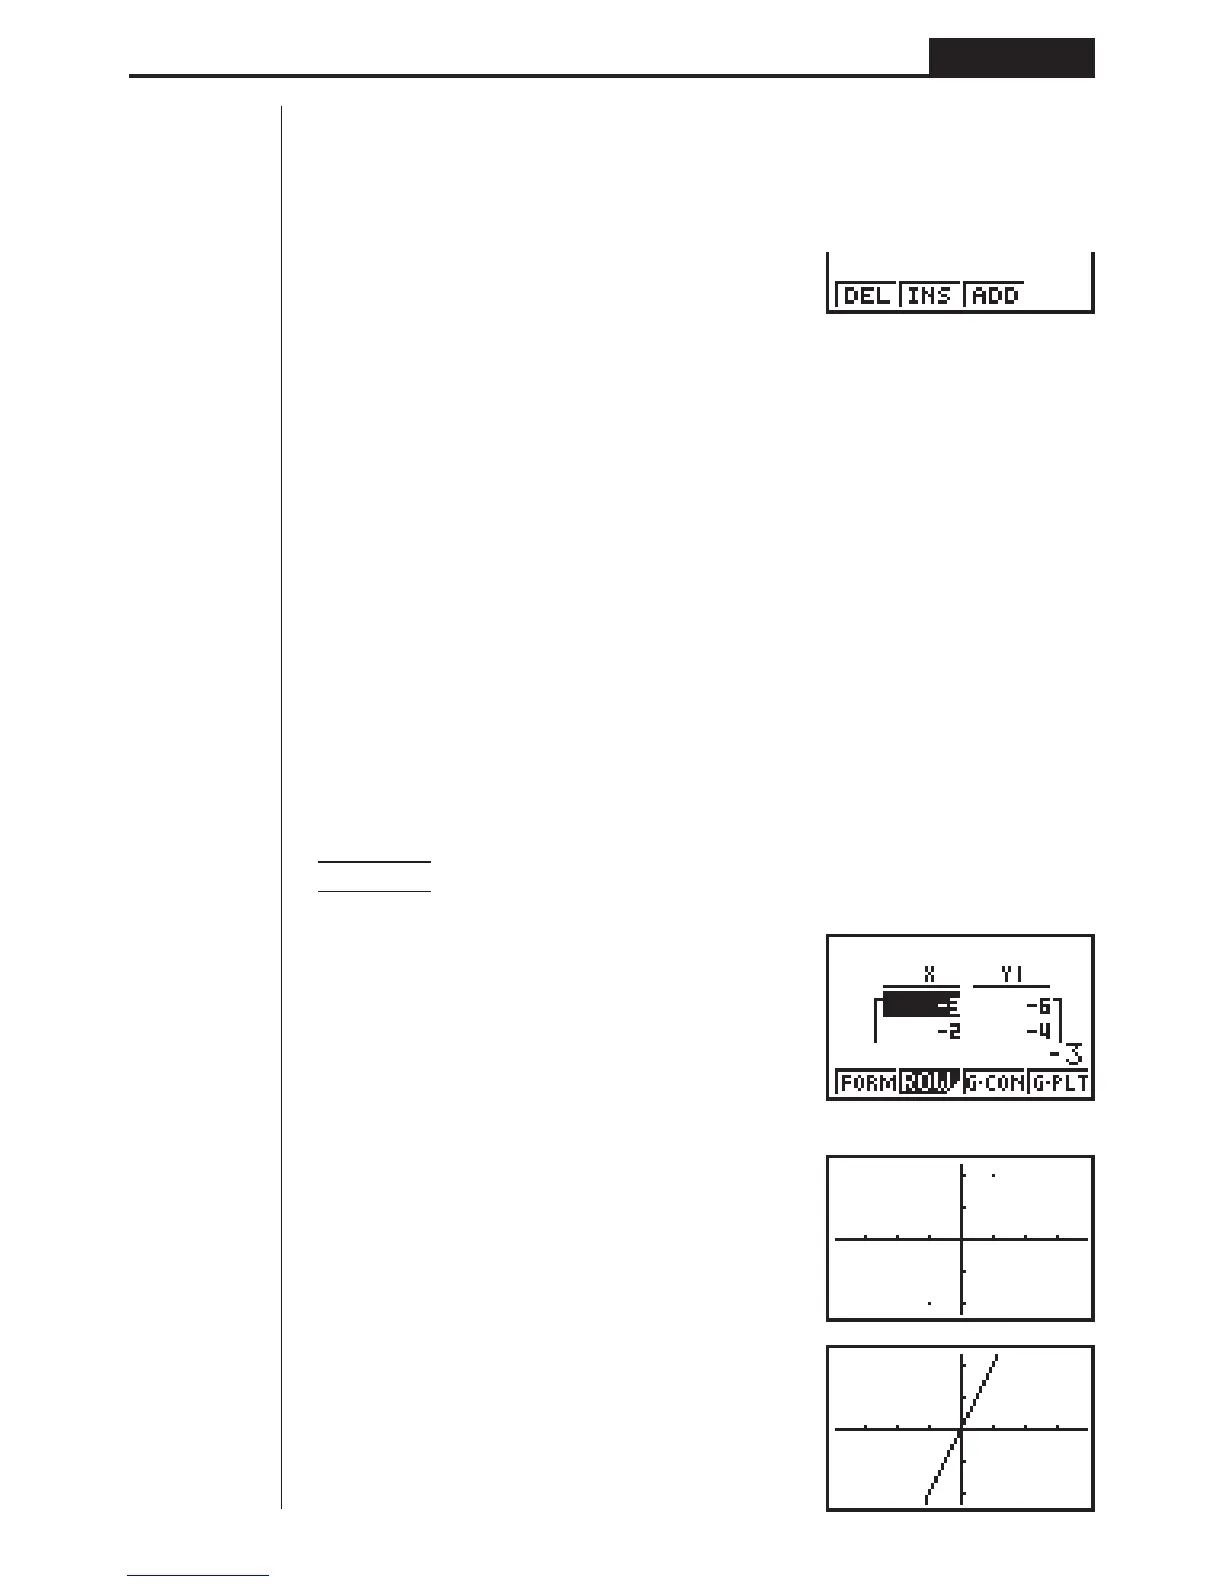
Press 2 (ROW) to display the Table Editing Menu.
2(ROW)
1 (DEL) ....... Deletes line where cursor is located.
2 (INS) ........ Inserts new line where cursor is located.
3 (ADD) ....... Insert new line below line where cursor is located.
6. Graphing a Function
You can use the two following function keys to produce a graph using the numeric
table currently on the screen.
3 (G-CON) .. Graph with connected plot points
4 (G-PLT) .... Graph with plotted points (unconnected)
• Note that you can also produce a G-PLT (4) graph by pressing w while a
numeric table is on the screen.
Example To graph the function Y1 = 2X, whose table of numeric values is
currently on the screen
4(G-PLT)
3(G-CON)
1234
1234