94
Statistical Graphs and Calculations Chapter 7
1. Before Performing Statistical
Calculations
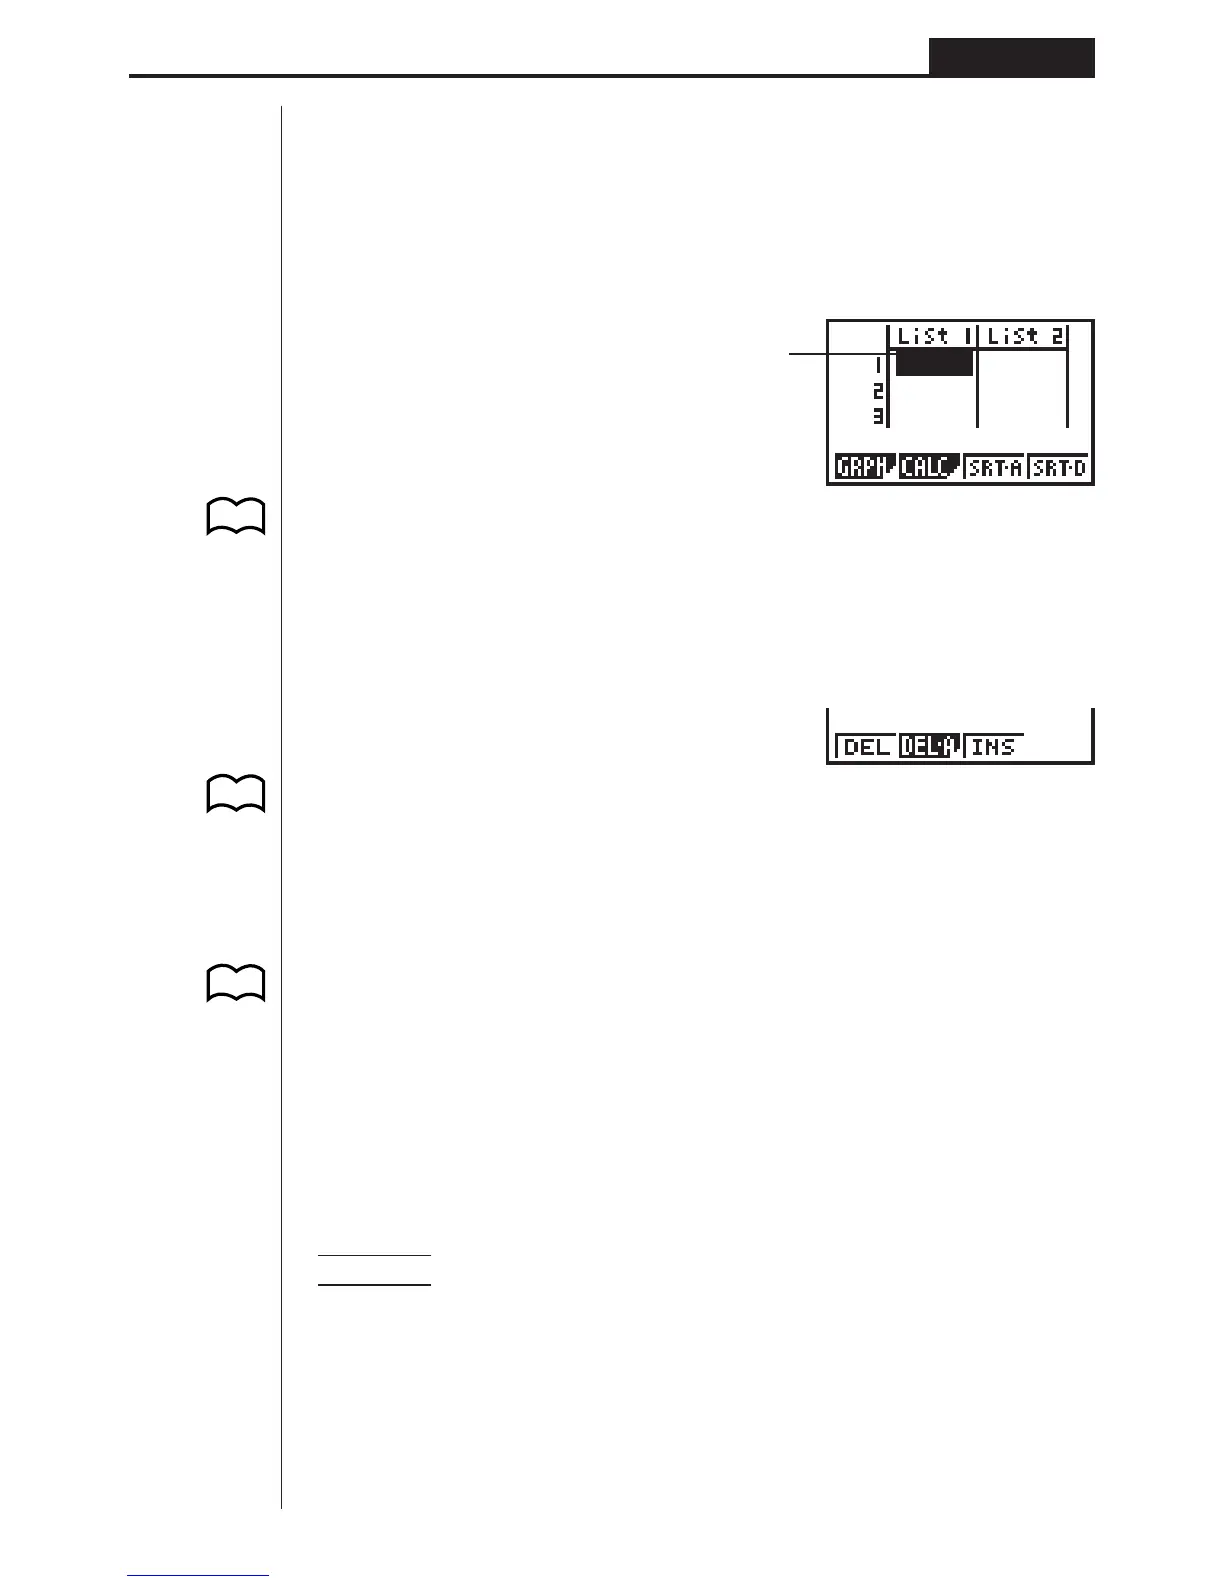
In the Main Menu, select the STAT icon to enter the STAT Mode and display the
statistical data lists.
Use the statistical data lists to input data and to perform statistical calculations.
1 (GRPH) .... Graph menu
2 (CALC) ..... Statistical calculation menu
3 (SRT•A) .... Ascending sort
4 (SRT•D) ... Descending sort
[
1 (DEL) ....... Single data item delete
2 (DEL•A) .... Delete all data
3 (INS) ........ Insert data item
Press [ to return to the previous menu.
• The procedures you should use for data editing are identical to those you use
with the list function. For details, see “Chapter 6 List Function”.
2. Statistical Calculation Examples
Once you input data, you can use it to produce a graph and check for tendencies.
You can also use a variety of different regression calculations to analyze the data.
Example To input the following two data groups and perform statistical
calculations
0.5, 1.2, 2.4, 4.0, 5.2
–2.1, 0.3, 1.5, 2.0, 2.4
1 2 3 4 [
1234 [
P.81
P.82
P.82
P.78
Use
f
,
c
,
d
and
e
to move
the highlighting around the lists.
P.95
P.113
P.83
P.84