101
Statistical Graphs and Calculations Chapter 7
1 (List4) ....... List 4 data is frequency data.
2 (List5) ....... List 5 data is frequency data.
3 (List6) ....... List 6 data is frequency data.
Press [ to return to the previous menu.
uu
uu
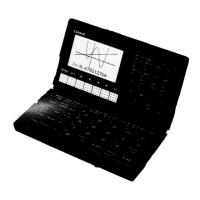
uTo select the plot mark type (M-Type)
1. While the general graph settings screen is on the display, use f and c to
move the highlighting to the M-Type item.
2. Use the function key menu to select the plot mark you want to select.
1 (
) ........... Plot using
2 (X) ............ Plot using X
3 (•) ............. Plot using •
kk
kk
k Drawing an xy Line Graph
Paired data items can be used to plot a scatter diagram. A scatter diagram where the
points are linked is an xy line graph.
Press Q to return to the statistical data list.
kk
kk
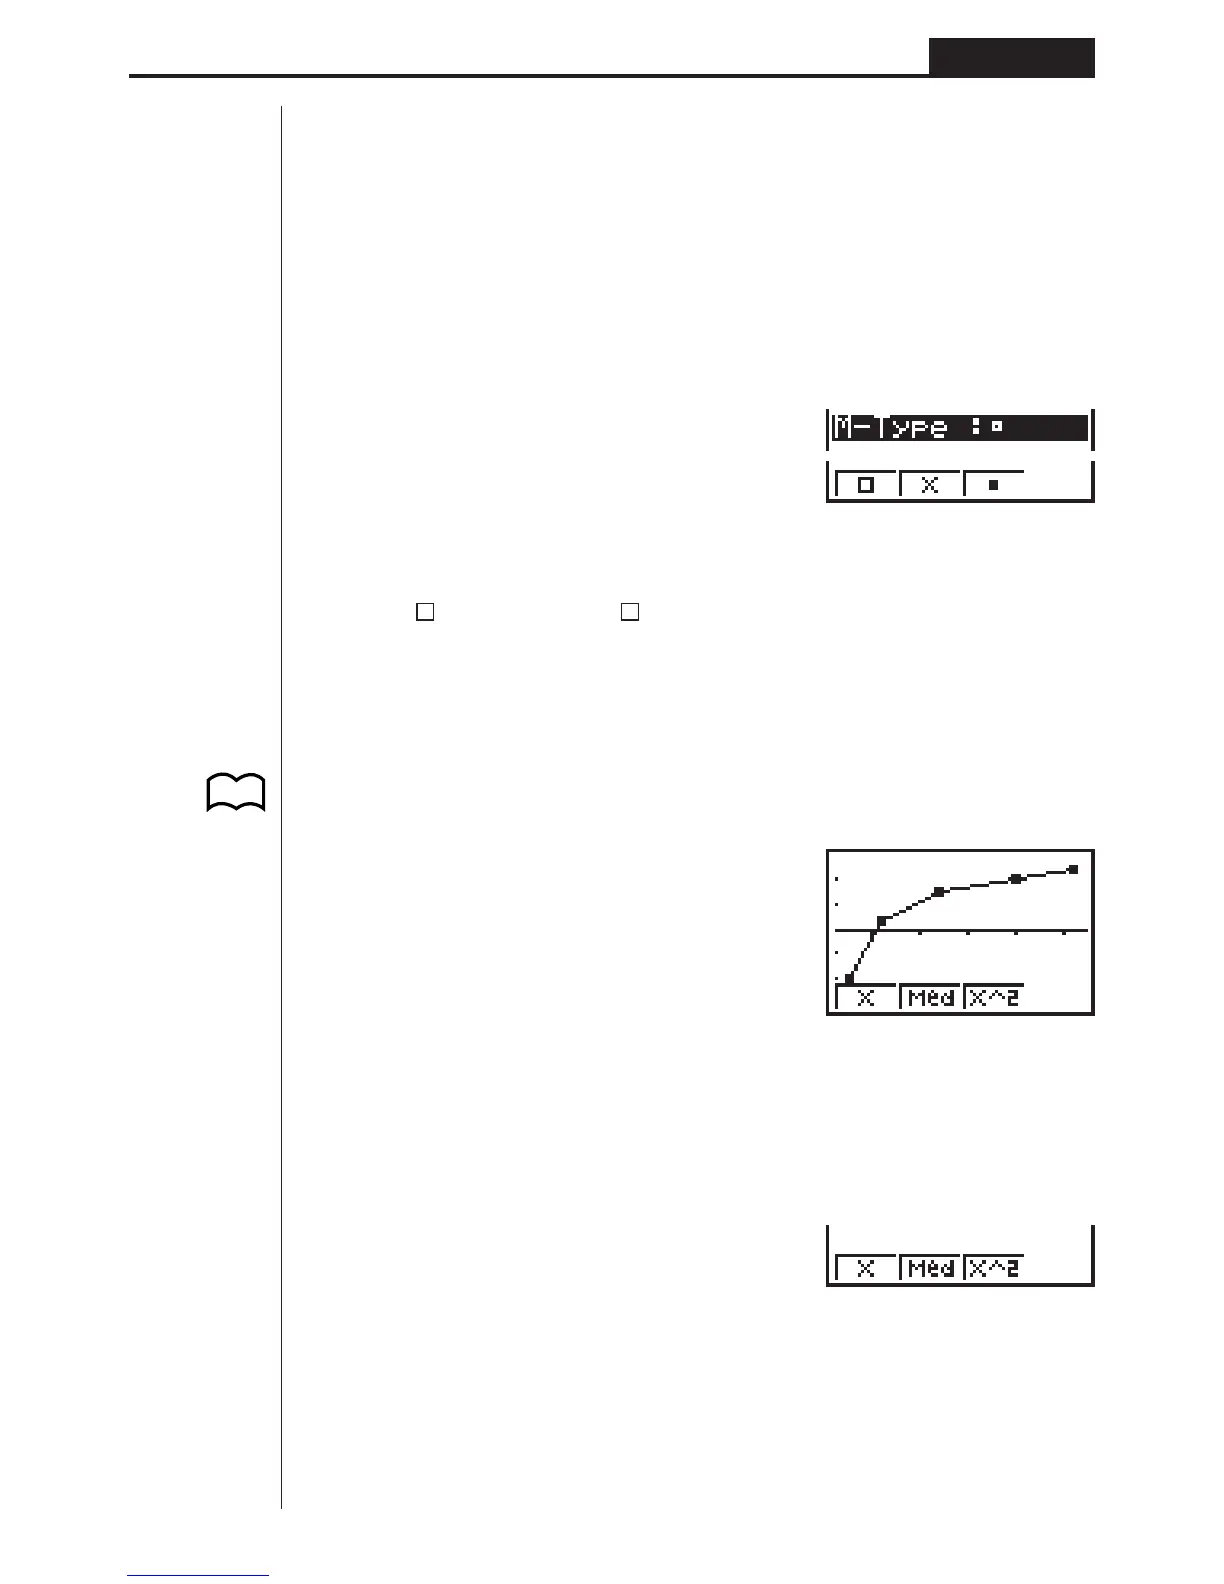
k Selecting the Regression Type
After you graph statistical data, you can use the function menu at the bottom of the
display to select from a variety of different types of regression.
1 (X) ............ Linear regression graph
2 (Med) ....... Med-Med graph
3 (X^2) ........ Quadratic regression graph
1234
1234 [
P.98
(G-Type)
(xy)