111
Statistical Graphs and Calculations Chapter 7
4(DRAW)
1(X)
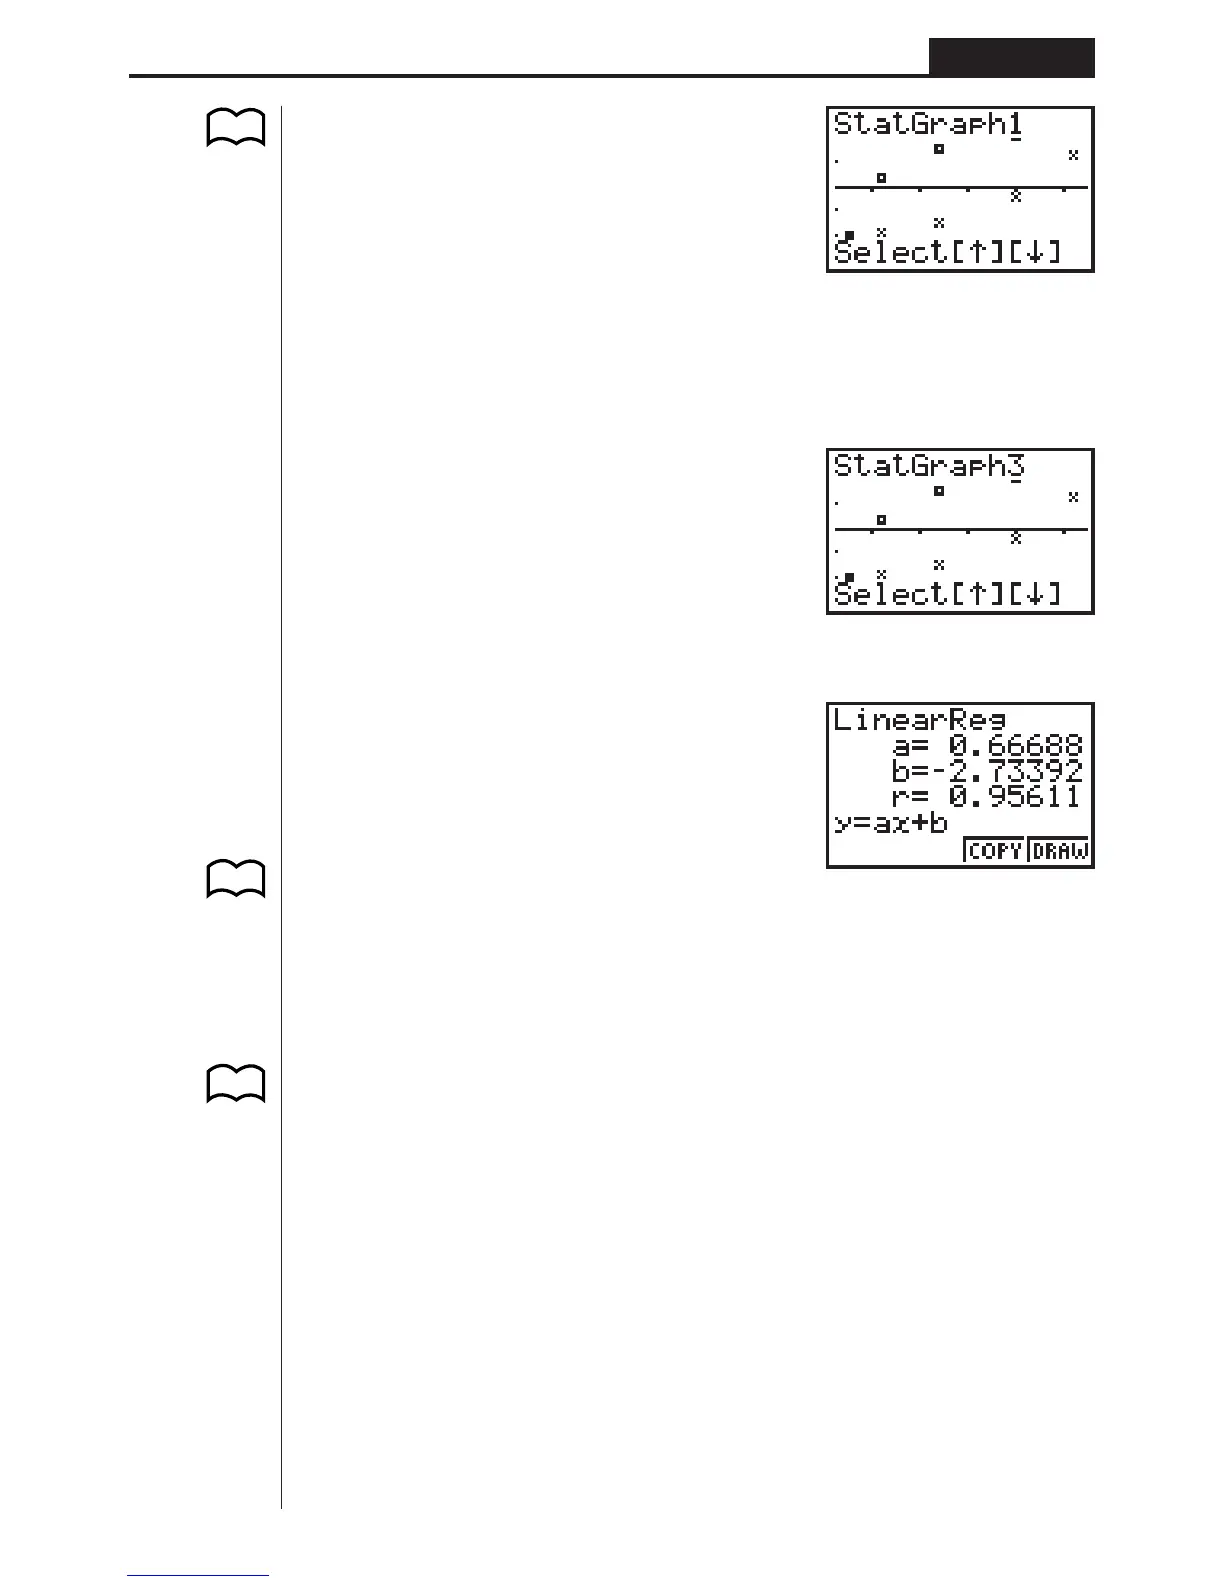
• The text at the top of the screen indicates the currently selected graph (STAT
Graph 1 = Graph 1, STAT Graph 2 = Graph 2, STAT Graph 3 = Graph 3).
1. Use f and c to change the currently selected graph. The graph name at the
top of the screen changes when you do.
c
2. When graph you want to use is selected, press w.
Now you can use the procedures under “Displaying Single-Variable Statistical Re-
sults” and “Displaying Paired-Variable Statistical Results” to perform statistical cal-
culations.
5. Manual Graphing
In all of the graphing examples up to this point, values were calculated in accord-
ance with View Window settings and graphing was performed automatically. This
automatic graphing is performed when the S-Wind item of the View Window is set to
“Auto” (auto graphing). You can also produce graphs manually, when the automatic
graphing capabilities of this calculator cannot produce the results you want.
kk
kk
k Setting the Width of a Histogram
When the S-Wind item of the View Window is set to “Man” (manual graphing), a
screen appears so you can specify the starting point and spacing of histogram bars.
P.104
P.109
P.8
P.101