102
Statistical Graphs and Calculations Chapter 7
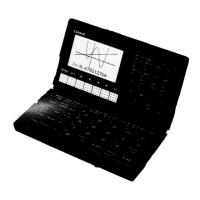
[
1 (Log) ........ Logarithmic regression graph
2 (Exp) ........ Exponential regression graph
3 (Pwr) ........ Power regression graph
4 (2VAR) ..... Paired-variable statistical results
Press [ to return to the previous menu.
kk
kk
k Displaying Statistical Calculation Results
Whenever you perform a regression calculation, the regression formula parameter
(such as a and b in the linear regression y = ax + b) calculation results appear on the
display. You can use these to obtain statistical calculation results.
Regression parameters are calculated as soon as you press a function key to select
a regression type while a graph is on the display.
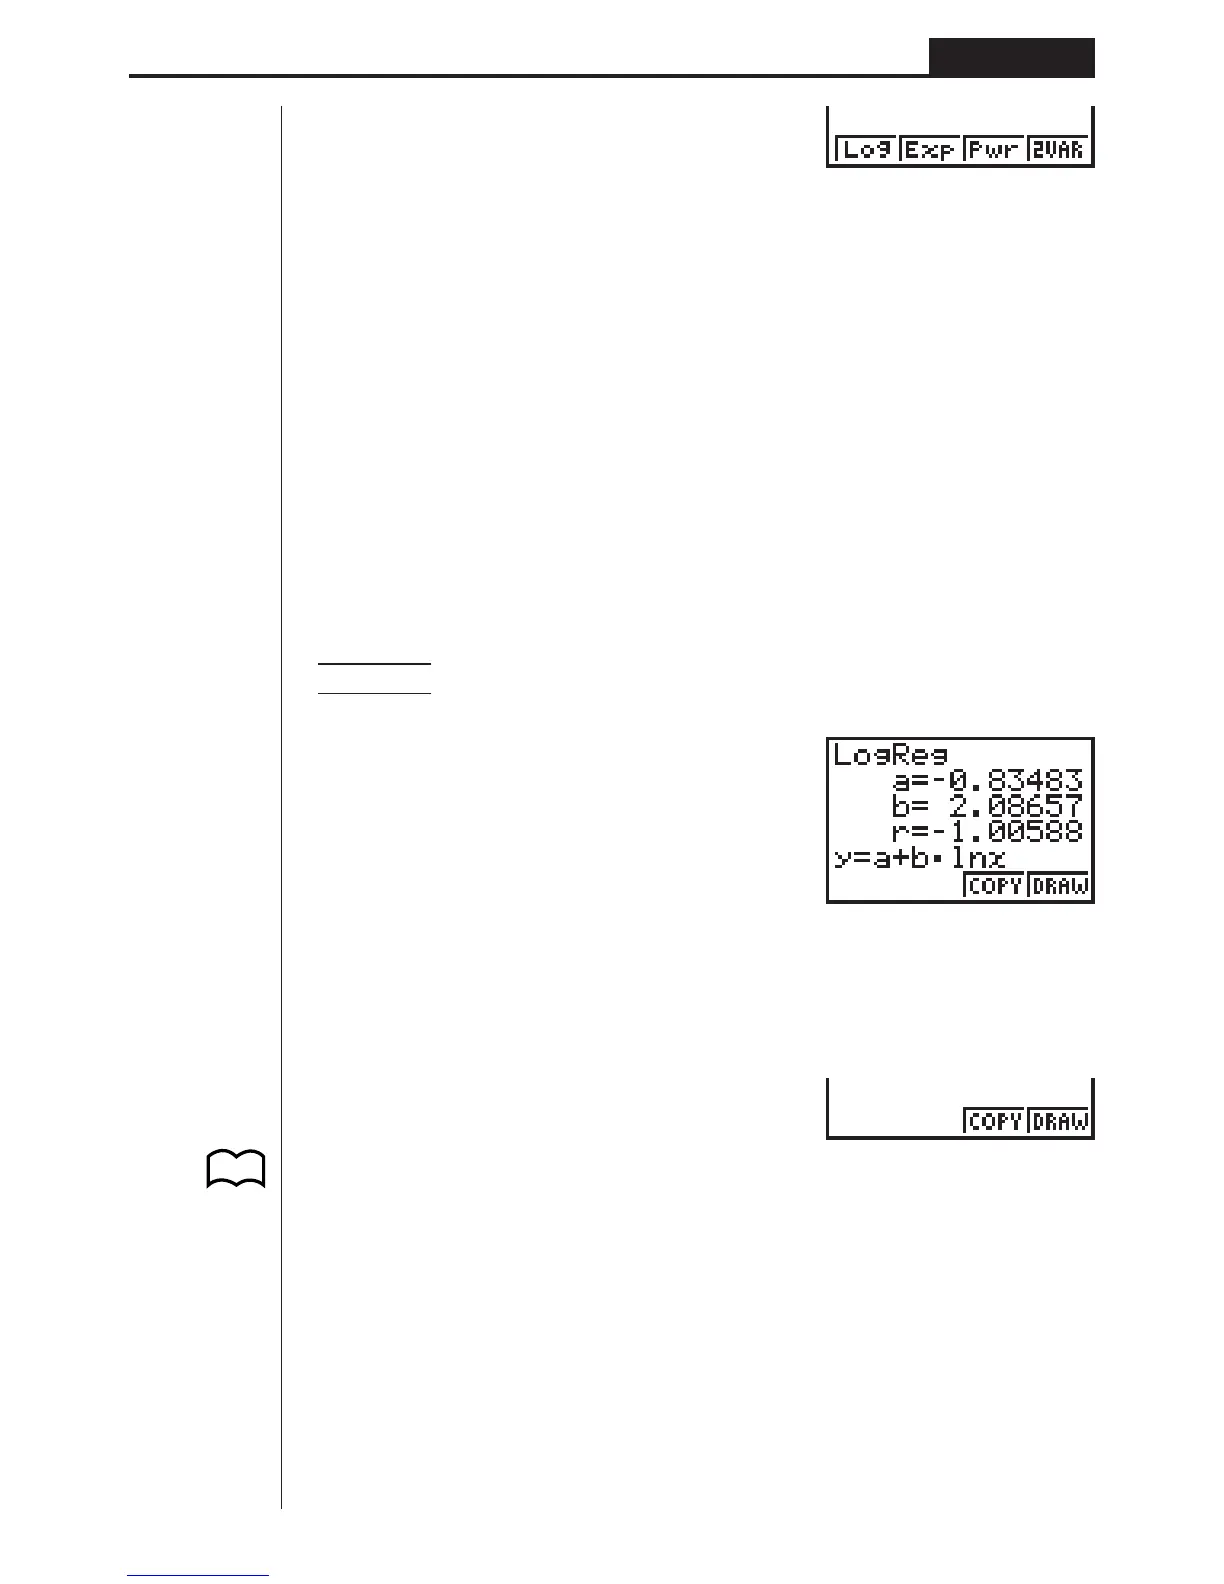
Example To display logarithmic regression parameter calculation results
while a scatter diagram is on the display
[1(Log)
kk
kk
k Graphing statistical calculation results
You can use the parameter calculation result menu to graph the displayed regres-
sion formula.
3 (COPY) .... Stores the displayed regression formula as a graph function
4 (DRAW).... Graphs the displayed regression formula
1 2 3 4 [
1234
P.110